
Timeframe: Hourly
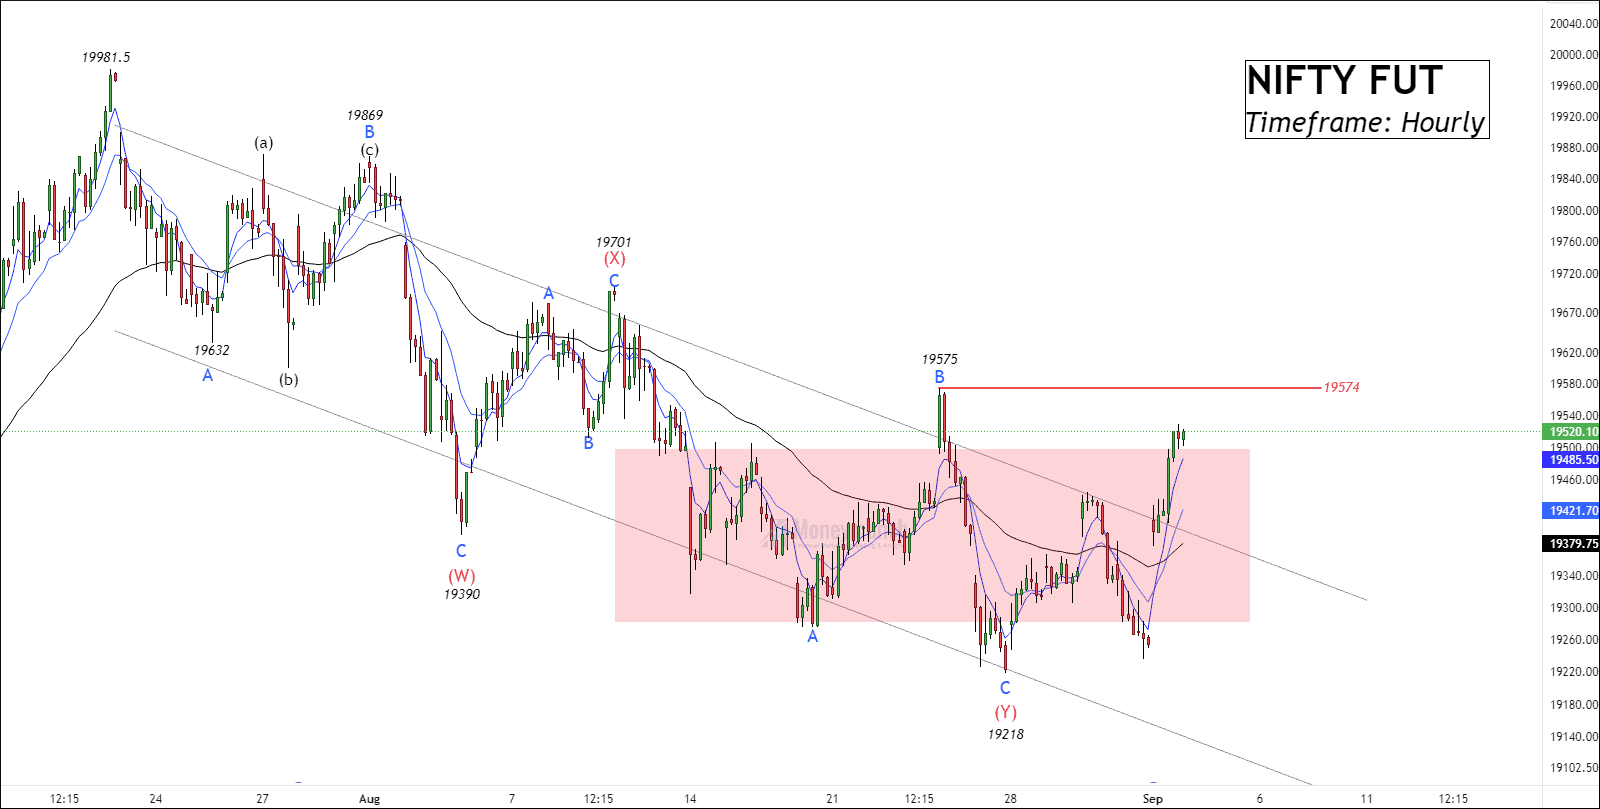
NSE NIFTY has formed a descending channel on the hourly timeframe chart. The price has formed w-x-y formation where wave (Y) occurred at 19218. The value area construction is also visible, and the price has traded near the upper band.
The price has been trading above 5, 13 & the 50 Moving average. NSE nifty has given a sharp move after accomplishing wave c of wave (Y). Price shaving a stringent resistance level of 19575. If the price breaks wave B, traders can trade for the following targets: 19680 – 19850 – 19940. This level is crucial that the failure will continue its correction. Note that traders may get a pullback of 19445.
We will update further information soon.
Get free important share market ideas on stocks & nifty tips chart setups, analysis for the upcoming session, and more by joining the below link: Stock Tips
Have you any questions/feedback about this article? Please leave your queries in the comment box for answers.
Great idea, I appreciate your efforts.
Good one! also analyze bank nifty
Thanks for sharing the chart