

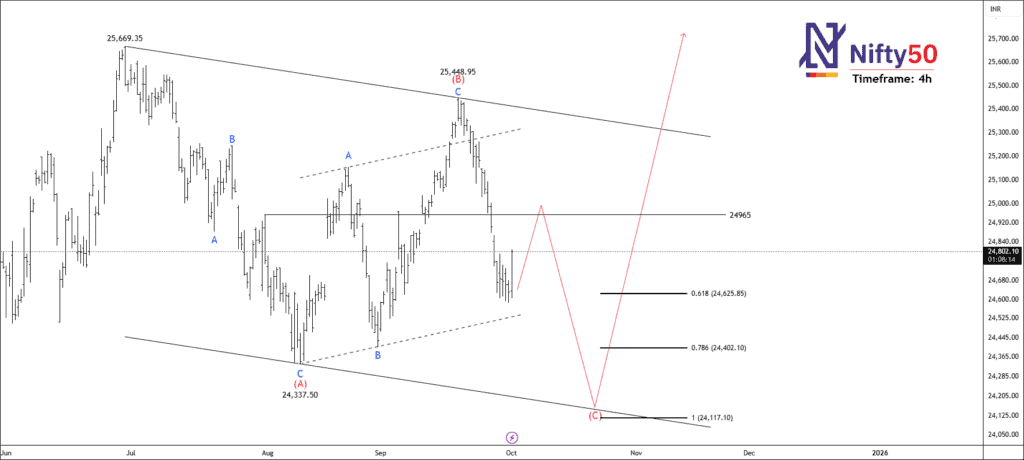

After making a high of 25,669.3, the price started falling into a corrective formation. Wave B (flat) occurred at 25,448, from where the price has declined by about 3%. Currently, the price remains within the corrective channel. Nifty also attempted to break below the 200 EMA on the 4H timeframe chart.
We can expect the price to continue falling after a pullback, with possible correction targets at the following levels:
- 61.8% Fibonacci extension of wave (A): 24,625
- 78.6% Fibonacci extension of wave (A): 24,402
- 100% Fibonacci extension of wave (A): 24,117
At a glance, NSE NIFTY has no clear sentiment as it stays in the middle of the movement. There is a flag formation on the monthly timeframe chart that indicates the bulls have just taken a pause.
We will update further information for premium members soon.
Get free important share market ideas on stocks & nifty tips chart setups, analysis for the upcoming session, and more by joining the below link: Stock Tips
Have you any questions/feedback about this article? Please leave your queries in the comment box for answers.

are you aiming for new all time highs??
Awesome and I think that nifty and banknifty both can head higher
Great to see a detailed Elliott view!