


Timeframe: Daily
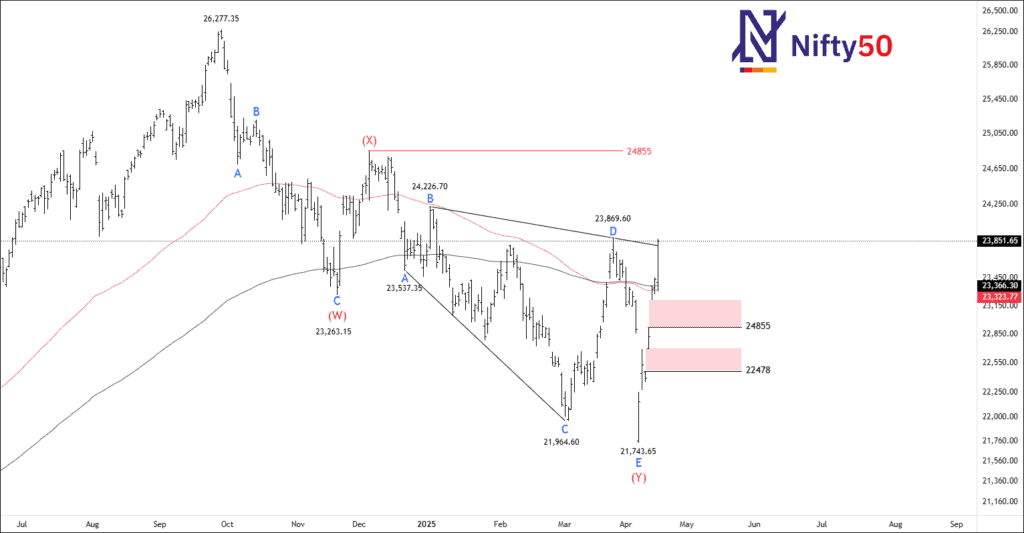
NIFTY chart reveals a corrective Elliott Wave structure in play, specifically a W-X-Y complex correction. The price initially formed a classic A-B-C correction completing Wave (W) near 23,263, followed by a counter-trend rally to 24,226, marking Wave X. A second corrective leg unfolded as an A-B-C-D-E triangle, with Wave (Y) ending at 21,743.65.
From a moving average perspective, the 100 EMA (black line) and 200 EMA (red line) are currently acting as resistance levels. Price is testing the 100 EMA, with the 200 EMA slightly above around the 24,000 zone. If price breaks out wave (D) at 23869, traders can trade for the following targets: 24400 – 25050 – 25505+. Two gaps can be retracements if the price fails to sustain above wave D.
Get free important share market ideas on stocks & nifty tips chart setups, analysis for the upcoming session, and more by joining the below link: Stock Tips
Have you any questions/feedback about this article? Please leave your queries in the comment box for answers.

I made payment through gpay for 1 year fees today. I got service activation message. How to use your mobile app sir?
Agree with the bullish view. Thanks for sharing.
Excellent and comprehensive analysis.
First time my good experience in this market . Such good service