
Weekly TImeframe:
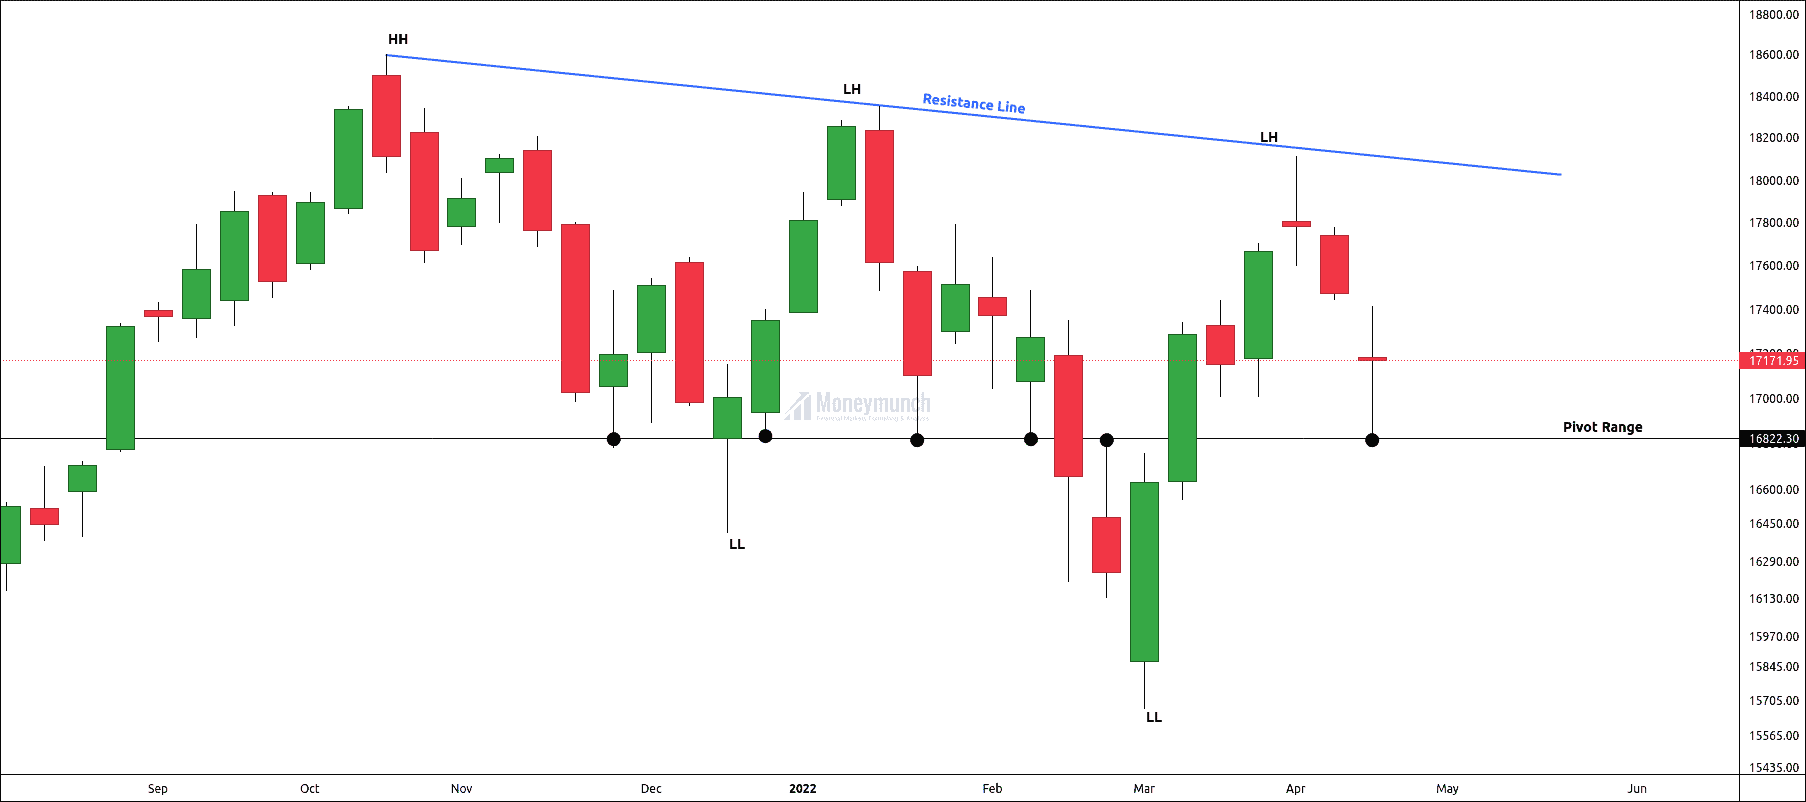
Nifty has created a lower high at 18114 on the weekly timeframe chart. Price has taken the support on the pivot range of 16800.
Currently, Nifty has formed a long-legged Doji on the pivot range, which signals indecision phrases of the market.
If the price fails to hold 16822, we may see a sharp downfall.
Doji is a reversal signal reversal, but it needs to be confirmed.
Daily Timeframe
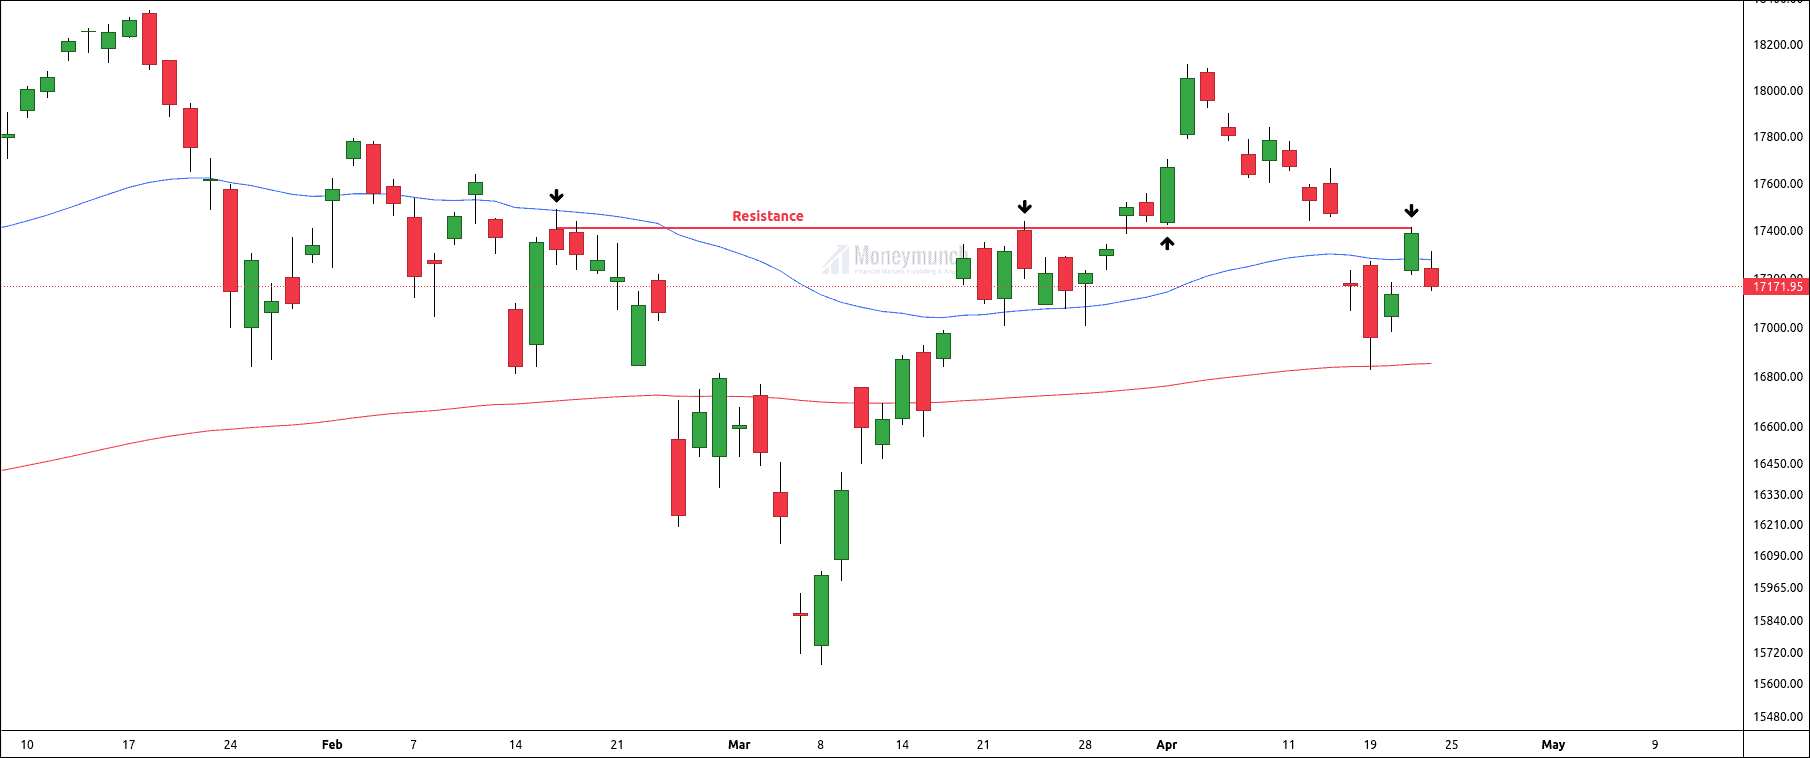
It has broken down the 50 & 100 EMA. If it gives a consecutively closing candle below the 50 EMA, then nifty can retest the 200 EMA or 17000.
Price has faced strong resistance at 17400. Nifty Looks weak, and it will gap down.
I will update opportunity-based trade setup. To become a subscriber, subscribe to our free newsletter services. Our service is free for all.
Get free important share market ideas on stocks & nifty tips chart setups, analysis for the upcoming session, and more by joining the below link: Stock Tips
Have you any questions/feedback about this article? Please leave your queries in the comment box for answers.
Nice outlook. This is the perfect analysis i was looking for……
sir bank nifty ka analysis dijye, please we are waiting for your update sir
I am Mukul Desai. I have been watching your calls for more than 6 months. I found it very useful and accurate. Looking forward to your paid Option calls & swing trades.