
Timeframe: Daily
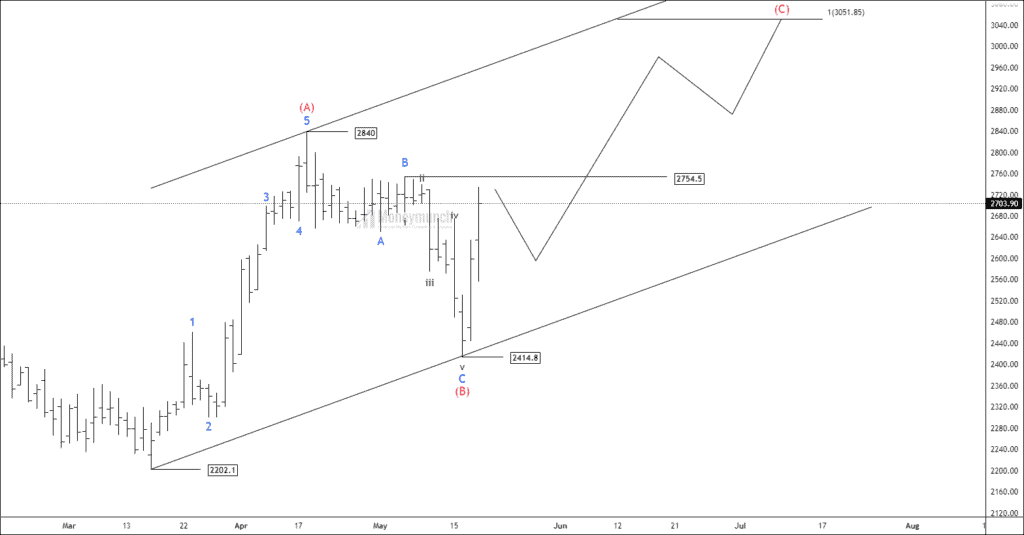
NSE HIL has exhibited a corrective pattern, completing the final wave C of wave (B) at 2414.8 and commencing the formation of an impulsive wave (C).
Currently, the price is trading below the 200-day Exponential Moving Average (EMA) but has shown signs of an upward movement near the EMA. The rising Relative Strength Index (RSI) and Average True Range (ATR) indicate the potential for a significant price movement.
According to the Elliott wave principle, a trend change can only occur after the breakout of wave (C). If the price manages to sustain above the level of wave (B) at 2754.5, traders can consider trading with the following targets in mind: 2840 – 2948 – 3045+.
Get free important share market ideas on stocks & nifty tips chart setups, analysis for the upcoming session, and more by joining the below link: Stock Tips
Have you any questions/feedback about this article? Please leave your queries in the comment box for answers.