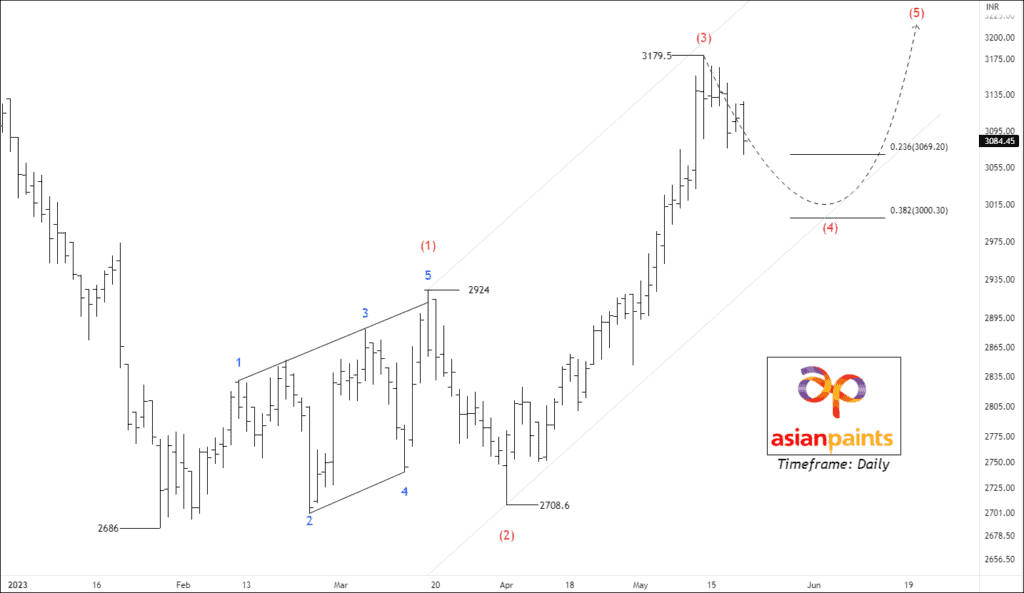
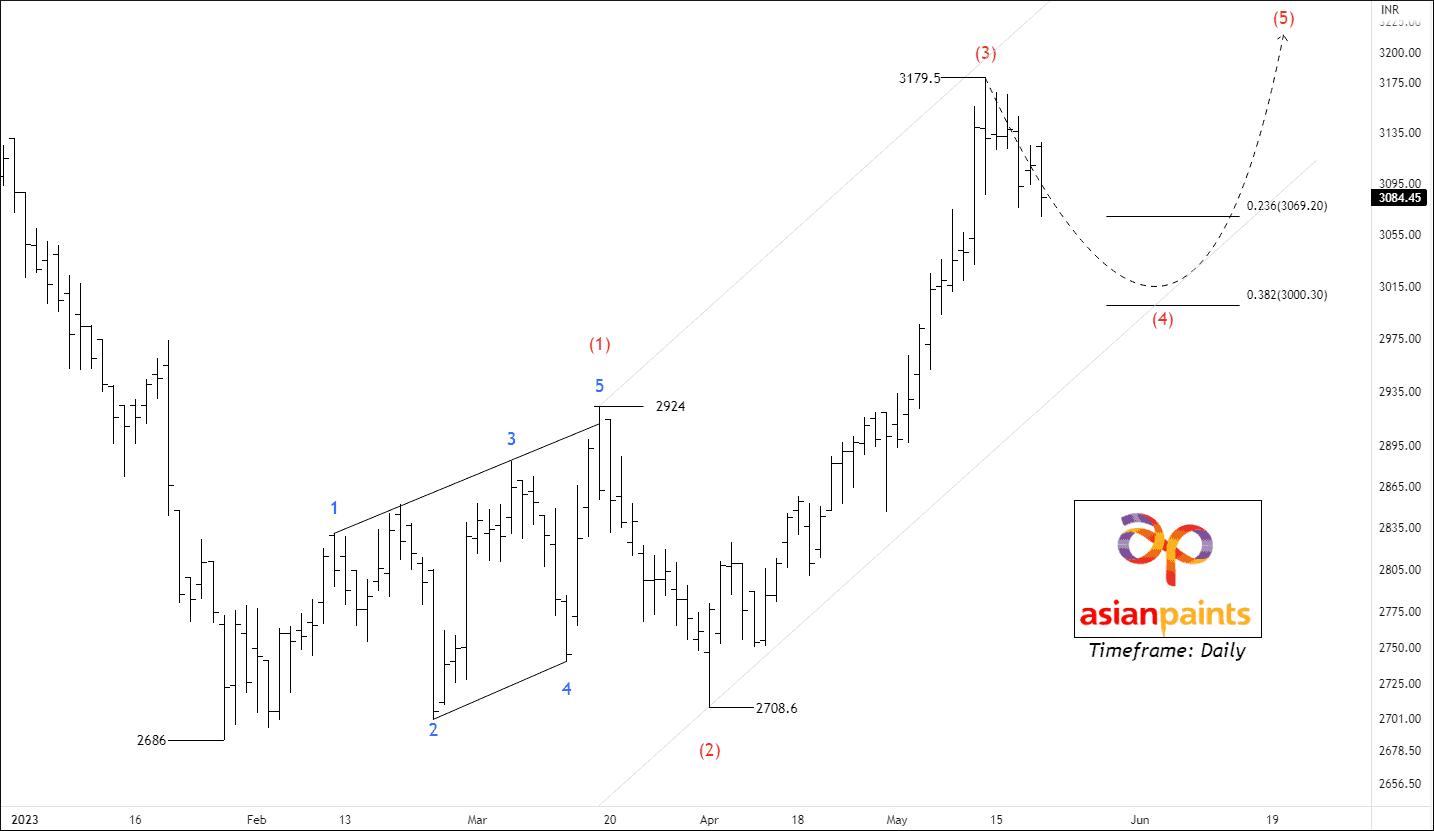
NSE ASIAN PAINTS – Unfolding an Impulsive wave (5)
Timeframe: Daily
The price has recently reached a significant low point of 2686, indicating the establishment of a new impulse cycle. Currently, the price action is showing strength by trading above the 50/100/200 moving averages.
During wave 1, the price formed a diagonal pattern, followed by a deep correction in wave 2. This suggests that the upcoming correction in wave (4) is likely to be either choppy, forming a triangle pattern, or a flat pattern.
Wave 3 has already occurred at 3179.5, reaching a 2.618% Fibonacci extension of wave 1. It’s worth noting that a common retracement level for wave 4 is typically around 38.2%. However, the current price retracement has only reached 23.6% so far. It’s important to remember that wave 4 should never trade within the price range of wave 1. Traders will be notified once wave 4 has been completed. Once wave 5 begins, traders can consider trading for the following targets: 3069 – 3142 – 3251+.
We will provide further updates and information in the near future.
NSE AXISBANK – Range breakout Setup
NSE AXISBANK has recently experienced a breakout above a crucial price range of 918 to 909. This breakout is considered significant in the market. Additionally, the price is currently trading above the 50, 100, and 200 Exponential Moving Averages (EMA), indicating a positive trend. The rising Relative Strength Index (RSI) further confirms the presence of bullish momentum in the stock.
If the price manages to sustain its position above 917.5, traders can consider entering trades with the following targets in mind: 928 – 937 – 949+.
NSE BAJAJ AUTO – Trade Setup For subscribers
 Unlock This Article
BALAMINES – Bearish Formation
NSE BALAMINES is currently exhibiting weakness on the daily timeframe chart. In the previous trading session, the price experienced a significant decline of over 2%. Furthermore, the price is currently trading below both the 100 and 200 Exponential Moving Averages (EMA), indicating a bearish trend. Additionally, the price is steadily moving toward the 50 EMA, suggesting a potential continuation of the downward movement.
If the price manages to sustain its position below the level of 2340, traders may consider selling with the following targets in mind: 2306 – 2274 – 2146+.
Get free important share market ideas on stocks & nifty tips chart setups, analysis for the upcoming session, and more by joining the below link: Stock Tips
Have you any questions/feedback about this article? Please leave your queries in the comment box for answers.
Great work! I am very much impressed with you analyzing skills.
Sir kindly update Nifty and banknifty for free members.
Spot on….