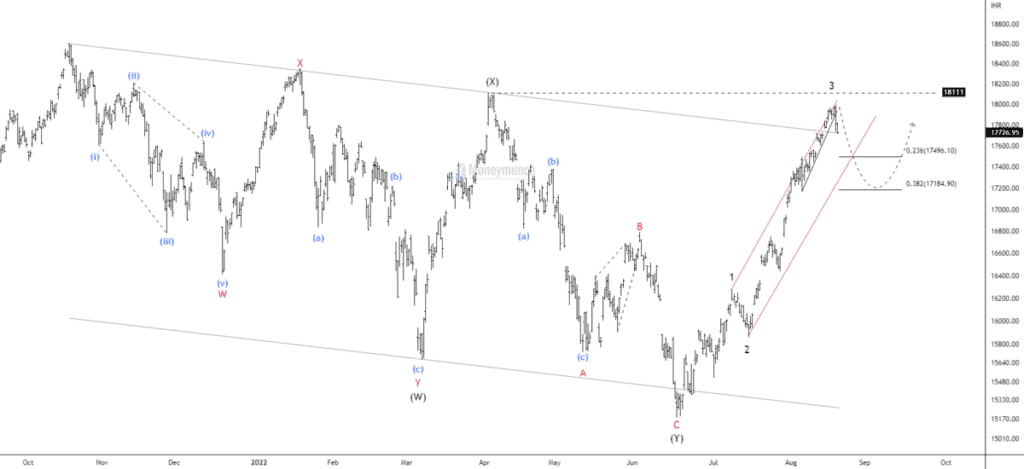
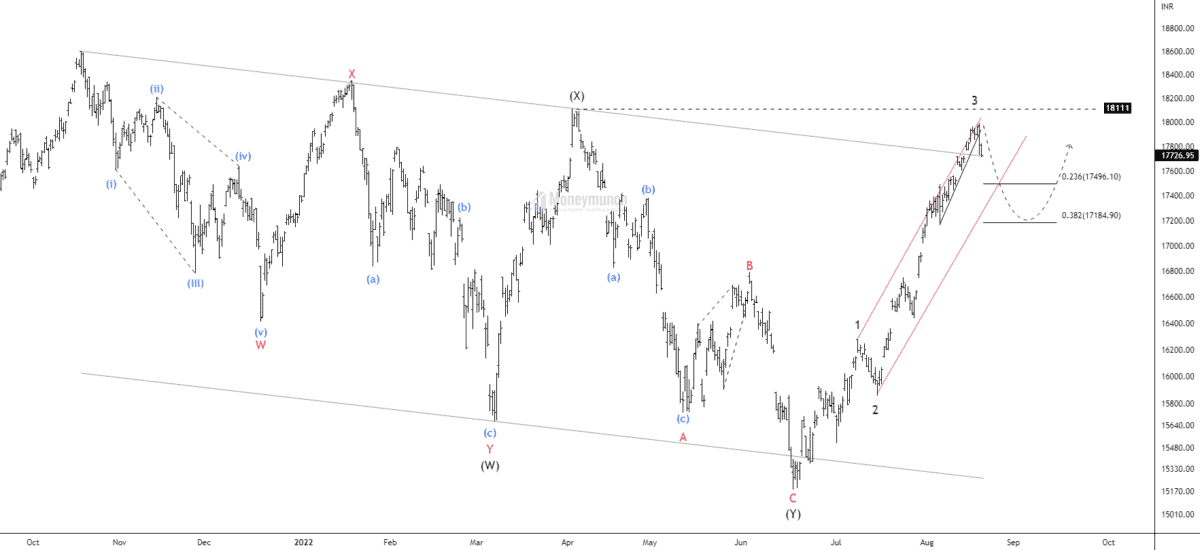
Nifty has reached 161.8% Fibonacci extension of wave 3, and we saw a decline in the previous trading session. After the breakdown of the wedge lines, It collapsed by 1.33%.
At this glance, the price is at the resistance band of the parallel channel. Uptrend is only possible above wave (x) at 18111. The wave (x) holds the power of the correction, Once it’s broken, prices start impulsive formation, and rejection may start a corrective structure again.
I have drawn an acceleration to find the ending point of the corrective structure. After breaking the upper band, the price will fall for the lower band of the parallel channel at 0.236% Fibonacci retracement. The common retracement for wave 4 is 0.382% of wave 3 at 17184.
After the pullback, if the price sustains above 17184.90, traders can trade for the following targets: 17555 – 17722 – 18111.
To become a subscriber, subscribe to our free newsletter services. Our service is free for all.
Get free important share market ideas on stocks & nifty tips chart setups, analysis for the upcoming session, and more by joining the below link: Stock Tips
Have you any questions/feedback about this article? Please leave your queries in the comment box for answers.
very good analysis
Good Effort!
one chart — different ways to look at, towards the same objective. Great work ! GOD blessings ! Thank yo
nice explanation..! thank you
Absolute Gem amongst the Nuggests of Wisdom you share with us — Thank
Nice analysis. It Helpes me to capture big move.
Good and Neat Analysis