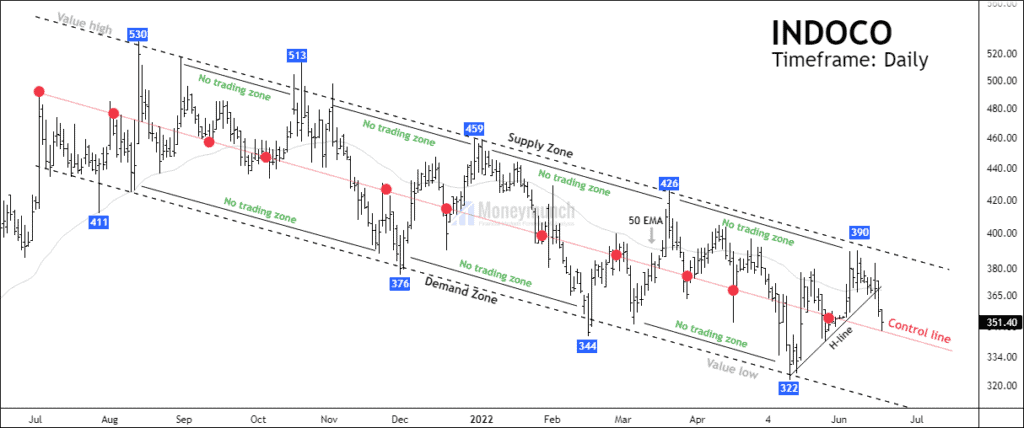
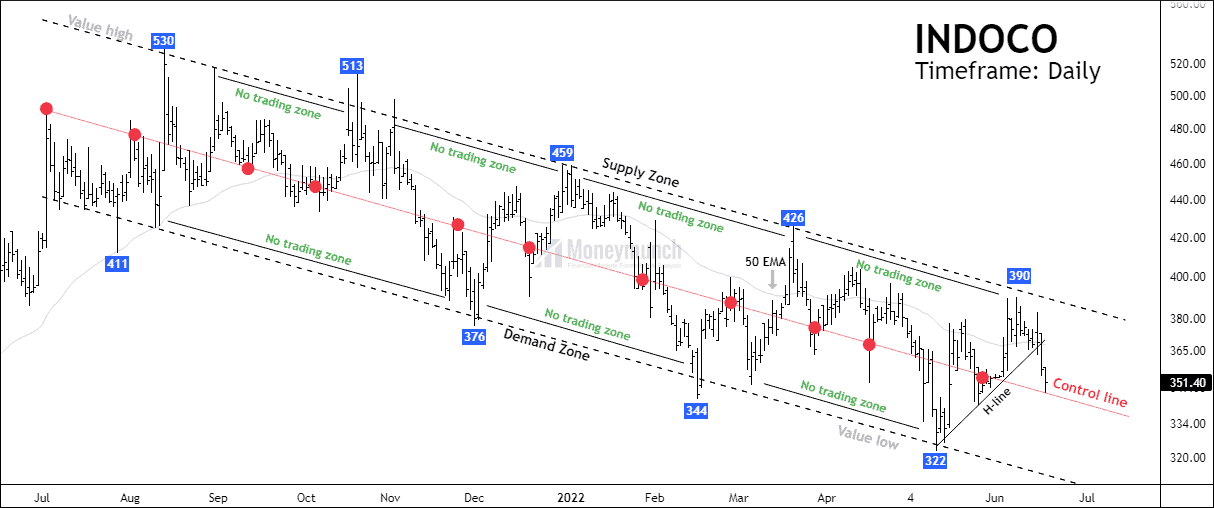
INDOCO has been steadily declining for over 11 months. The upper & lower bands are creating a fair value area without price excess.
Observe that the upper band shows five reversals and the lower-band shows three reversals. Prices have fallen sharply based on the breakdown of 50 EMA.
Currently, the price is on the control line at 350. The control line signals strong support until it breaks down. If the price breaks the control line, traders can trade for the following targets: 343 – 331 – 320 below.
To become a subscriber, subscribe to our free newsletter services. Our service is free for all.
Get free important share market ideas on stocks & nifty tips chart setups, analysis for the upcoming session, and more by joining the below link: Stock Tips
Have you any questions/feedback about this article? Please leave your queries in the comment box for answers.


First class analysis. This is going to be great trade if breakdown happens.
Nice review 👍👍👍
Good setup
Thank you for this analysis. Please share your views on Nifty 50 & Banknifty. I’ve made good profit in previous analysis.