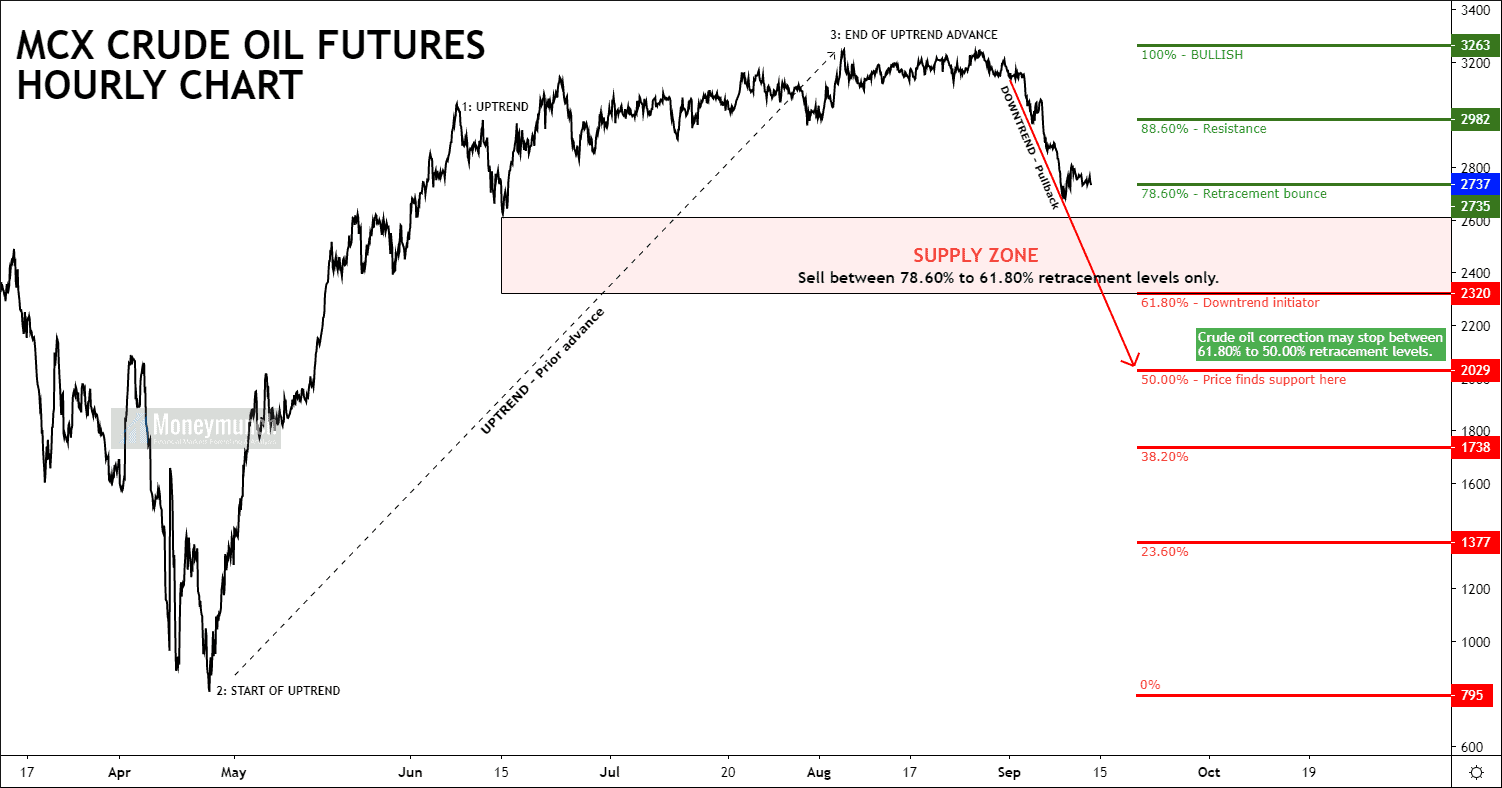
Was That the Top in Crude oil?
Crude oil price is running nearby a 78.60% retracement level, and it can act as support. Hence, trade with the trend: sell positions executed around 78.60% retracement level area for the targets of 2660 – 2600 – 2560 – 2500.
For long-term investors: they can hold for 2410 – 2320 levels.
Don’t sell crude oil above the 2740 level. It can start raising for 2980 – 3260 levels.
Gold and Silver Tips & Updates
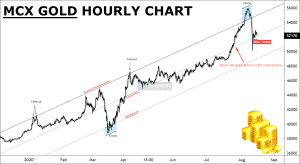
 Did you read the last report of gold? If not, click here.
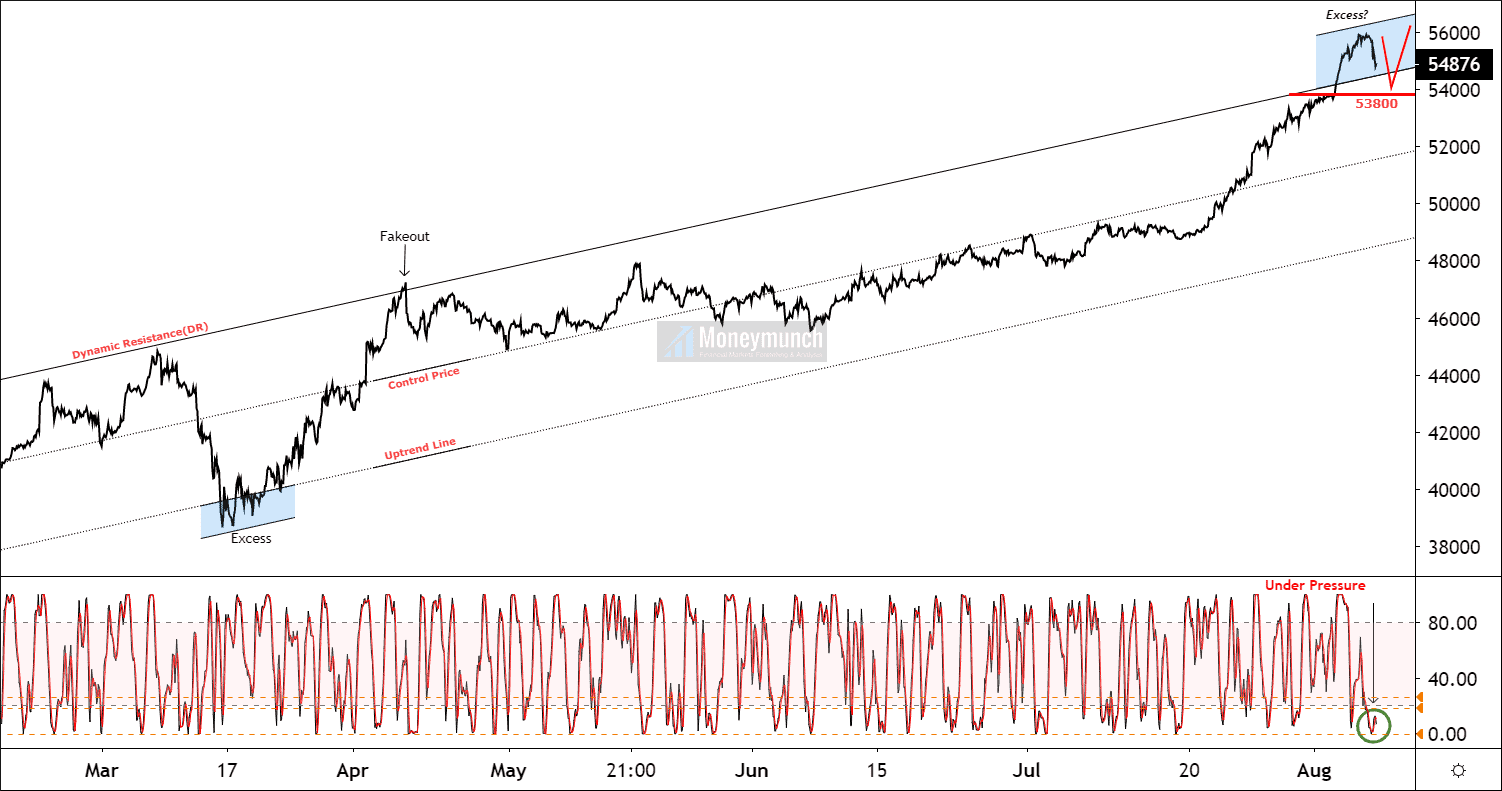
Hurdle: 52260
From this week, gold may start collapsing. And it should be run for the 50000 levels.
Don’t draw any position above the hurdle. ‘Cause it will fly from there.
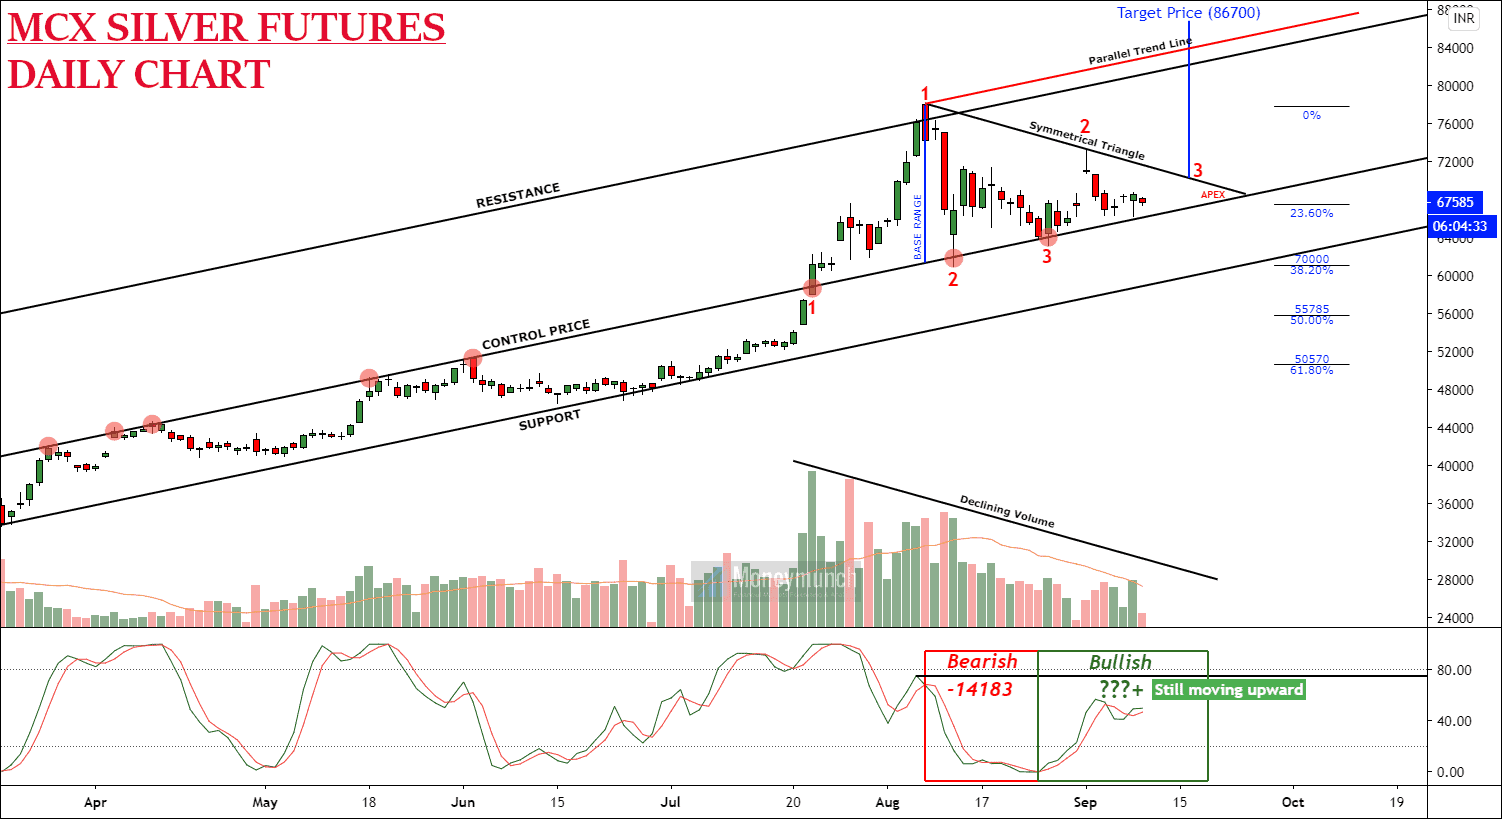
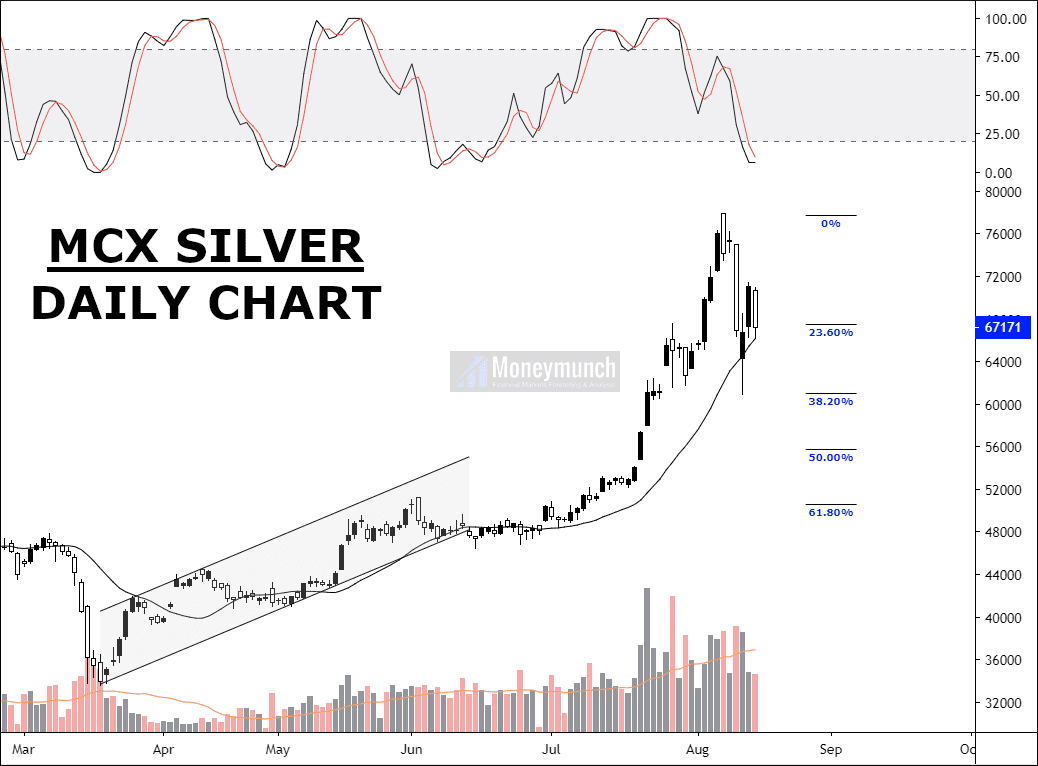
Click here to read the silver detailed report.
To become a subscriber, subscribe to our free newsletter services. Our service is free for all.
Continue reading

 Unlock This Article