Unlock the potential of bullion trading with our expert tips and analysis. From gold to silver, our research reports cover all aspects of the market to help you make informed decisions and maximize your profits.
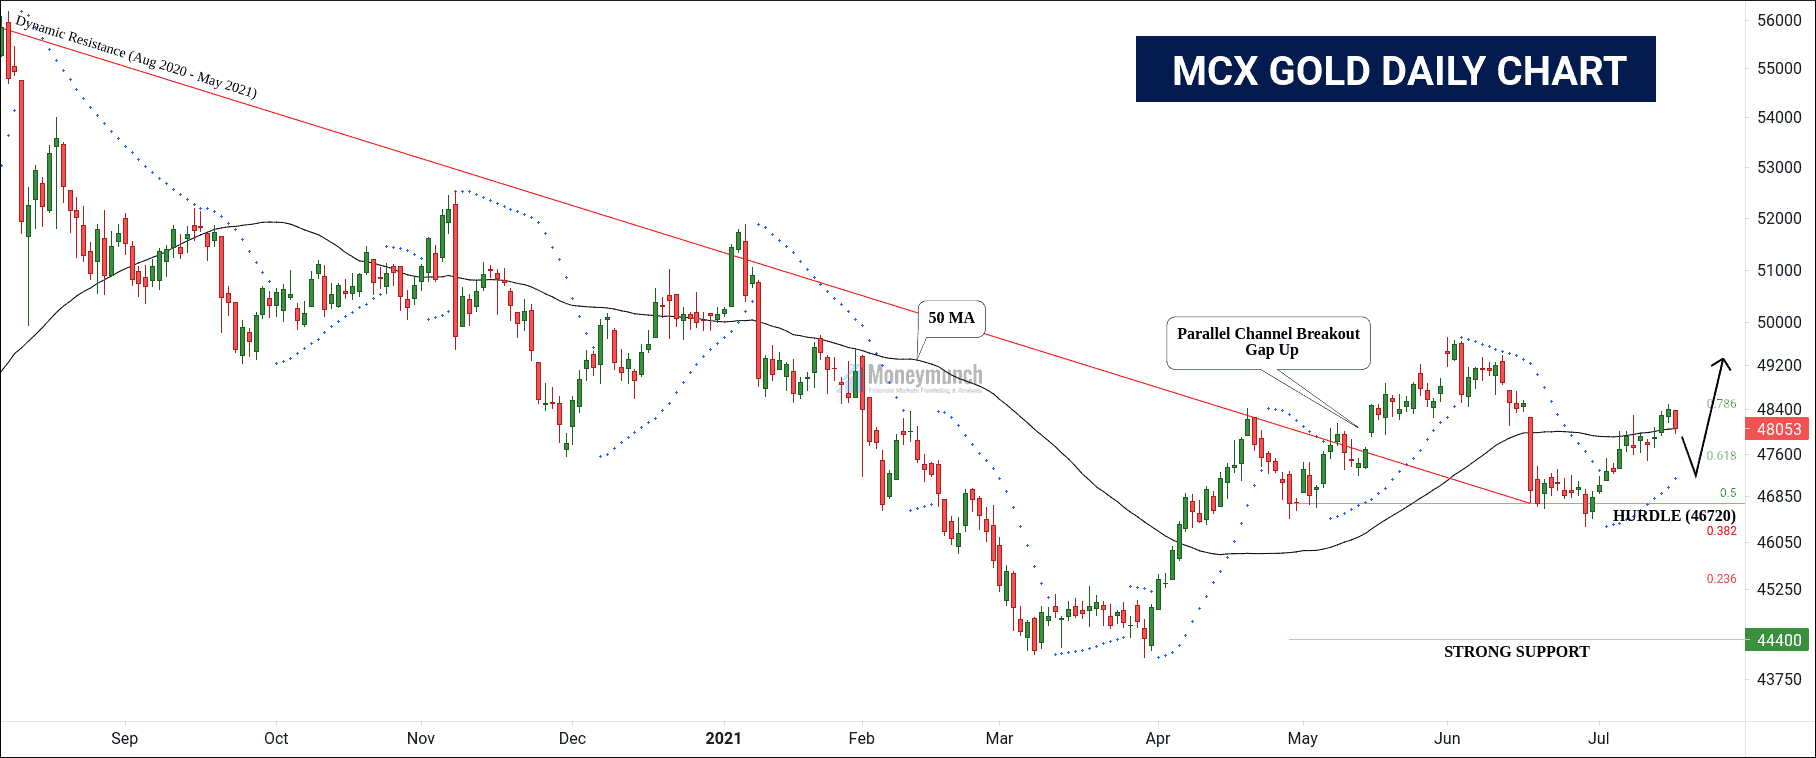
I have written, “It’s not sellable until following the above scenario. We can see the gold prices at 48000 – 49000+ in the upcoming days”. And MCX Gold has completed the first target in the last week.
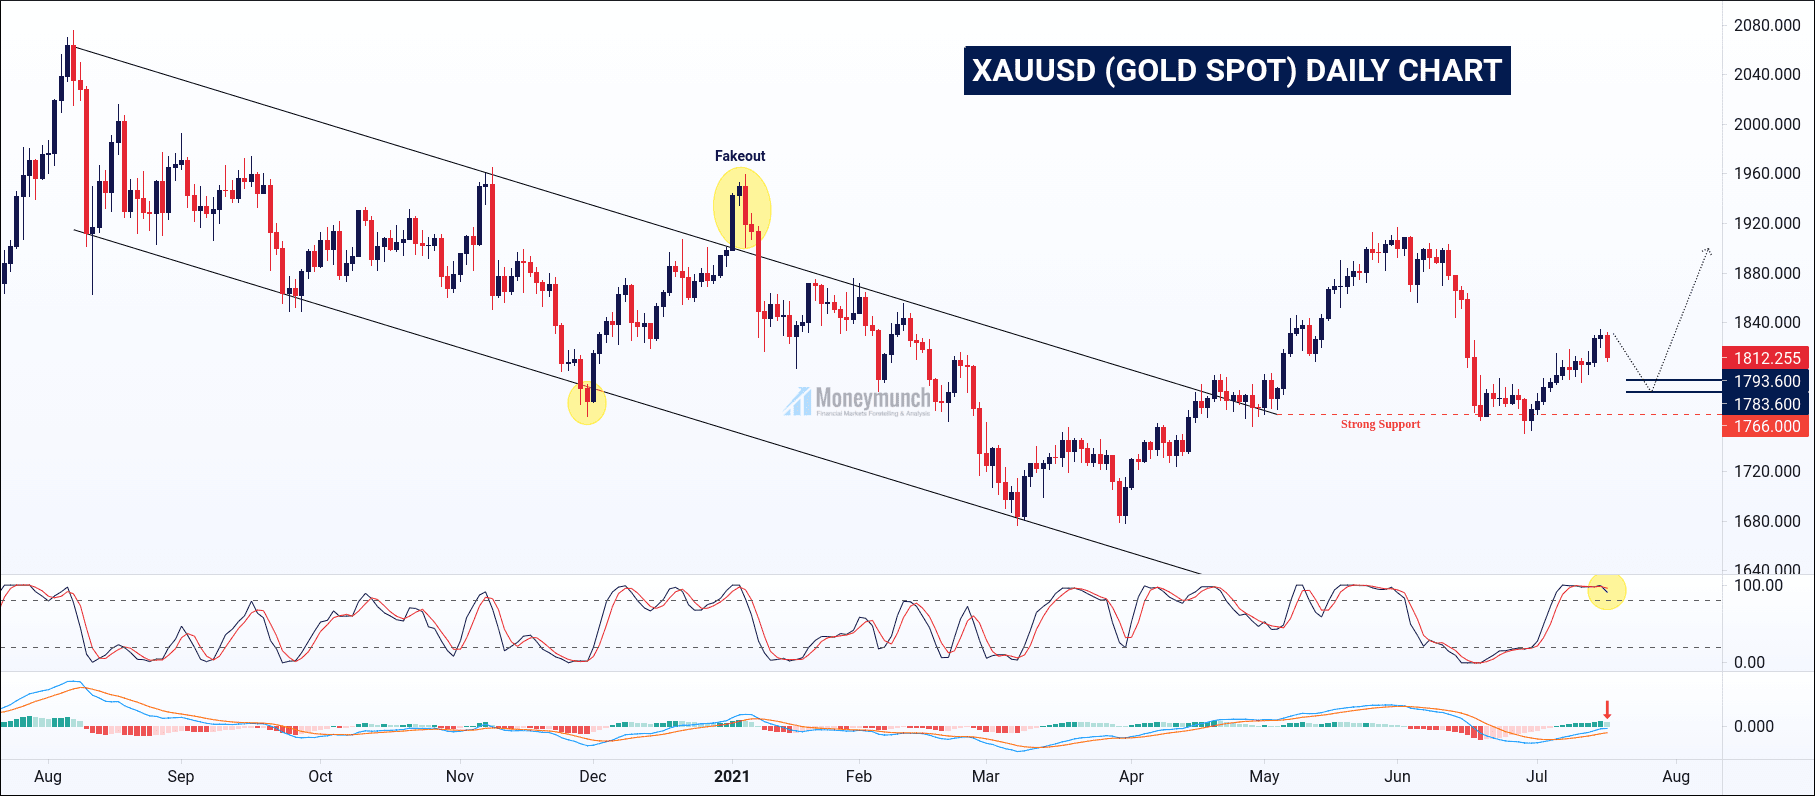
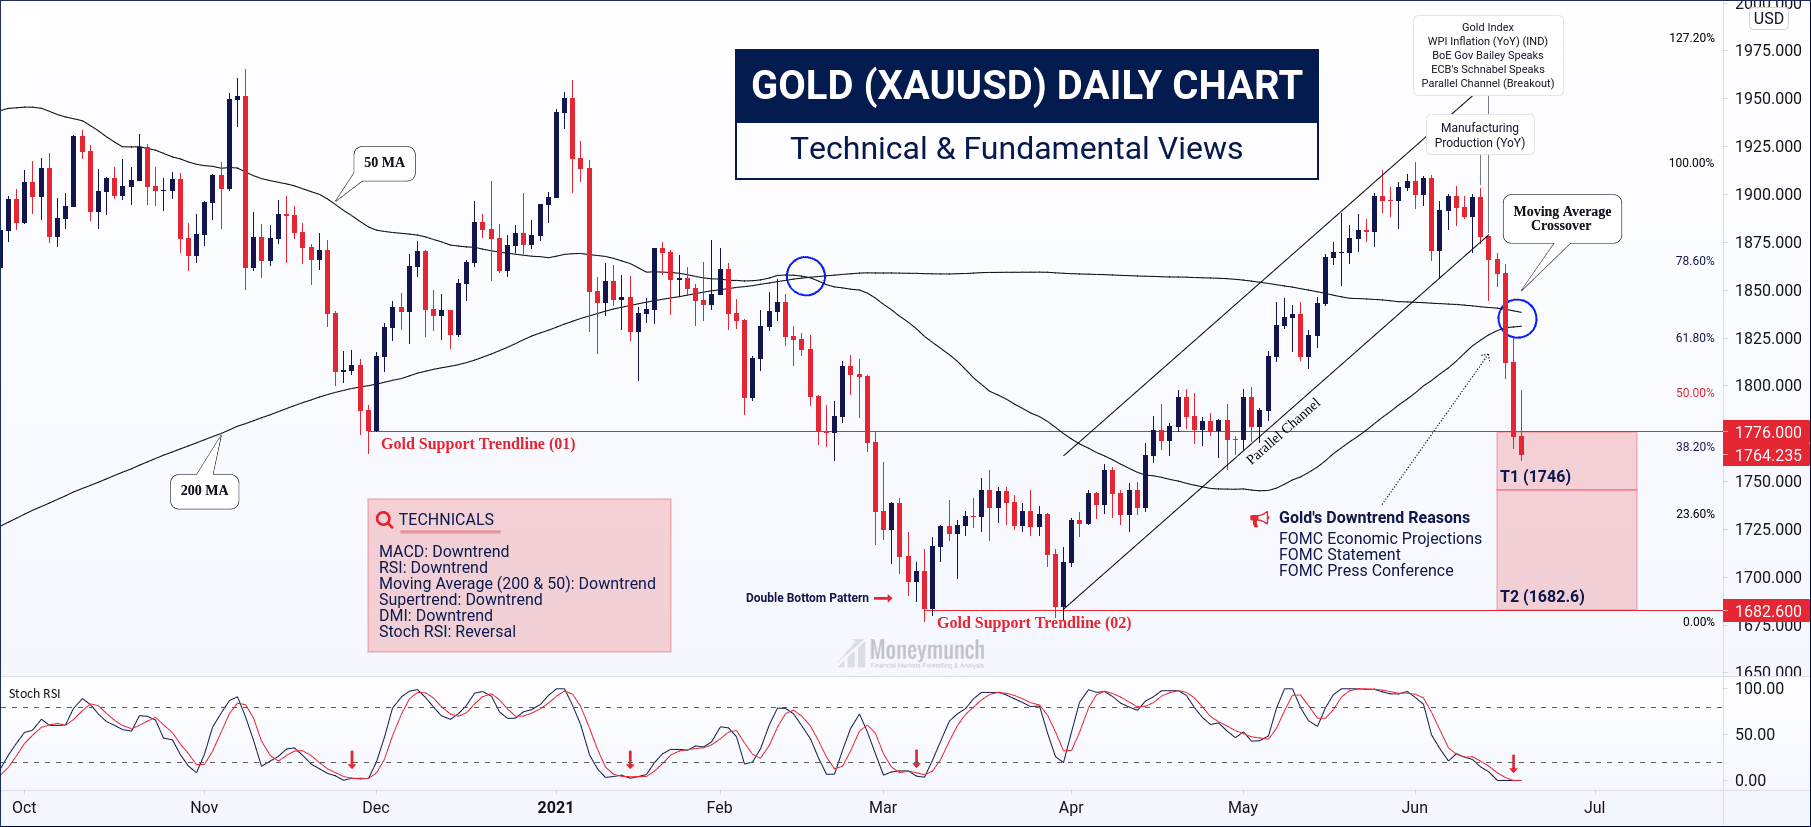
Gold spot needs to break 1809 levels to retest support of 1793.6 – 1783.6. These support levels will push the gold price higher. Gold isn’t sellable until the breakout of 1766 (strong support).
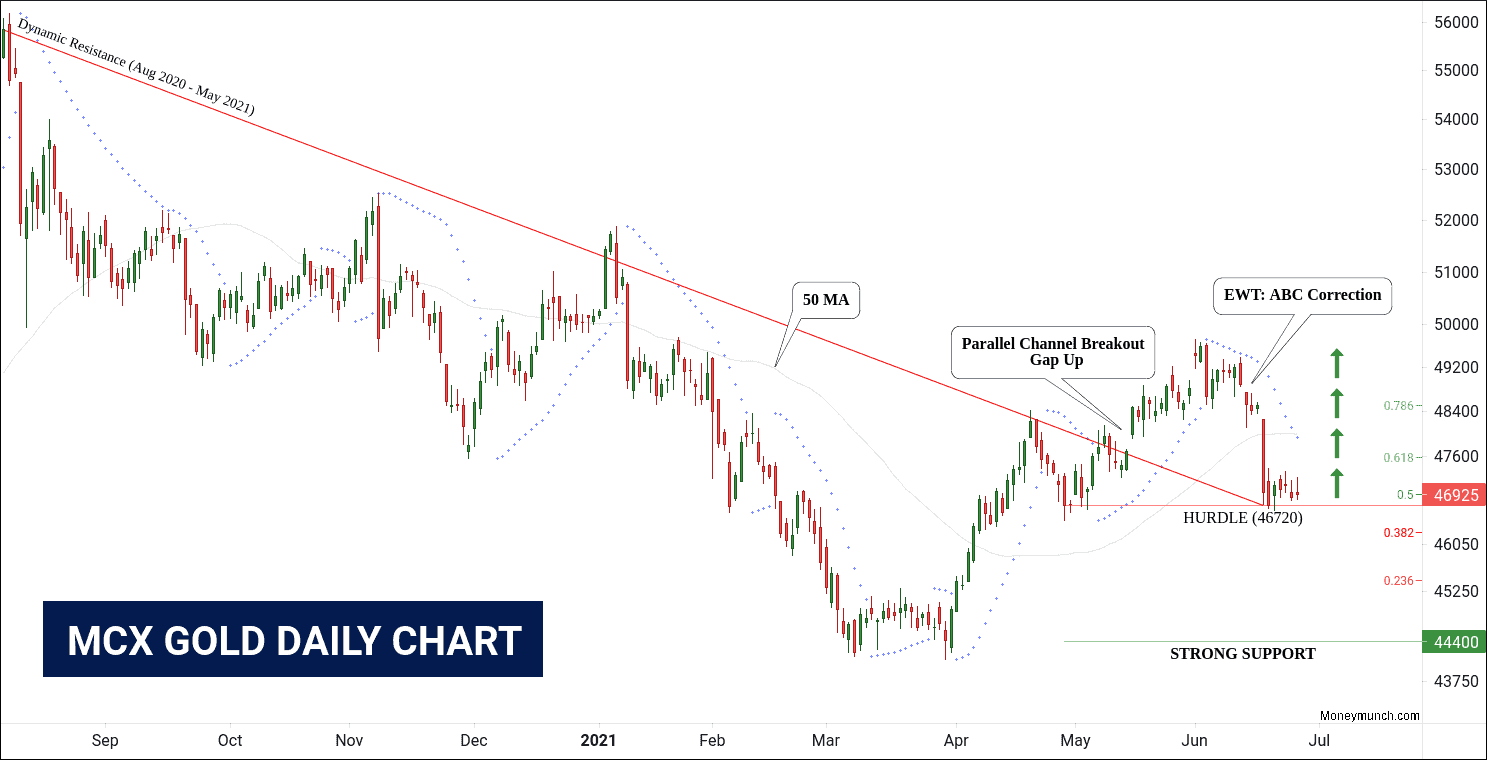
Key Levels: 46720, 46250.The corrective nature of the latest rebound suggests the Gold decline will continue. A break of hurdle will raise the possibility of the impulsive decline from near 46720. A strong selling signal will come after a breakout of 46250 levels. So, intraday (day) traders can start selling between hurdle and breakout levels for the target of 46000 – 45460 – 44900 below.But according to the current situation, gold is trying to recover the loss from the last 2 weeks’ events. It can’t be sell until following the above scenario. We can see the gold prices at 48000 – 49000+ in the upcoming days.Watch significant releases or events that may affect the movement of gold, silver & crude oil:Continue reading
In-depth analysis: Is it the right time to buy gold?
Gold (XAUUSD) and silver (XAGUSD) has crashed in the previous week. Gold has lost -113.585 points (-6.05%), and silver lost -2.14315 (-7.68%). Millions of CFD’s traders have lost money in that week.
Where’s gold’s bottom?
According to technical analysis and fundamentals research, gold can decline more. Gold has broken the strong support trendline (01) and marching for 02. If it doesn’t close above to trendline of 01 in the first two trading sessions, it will be unstoppable through high selling pressure by speculators. And we will see the target price 2.
Technically, the most popular indicators are indicating a complete downtrend. And Stoch RSI is signaling for a reversal. So, it can pull back up to a retracement level of 38.2% or 01 trendlines. If that not happen, gold can lose 81.635 points more.
In the previous week, gold and silver were falls due to economic events and high selling pressures by speculators. For advance traders, watch significant releases or events that may affect the movement of gold, silver & crude oil.
Tuesday, Jun 22, 2021 00:30 – FOMC Member Williams Speaks 01:00 – All CFTC Speculative net positions 11:00 – Gold Index 20:30 – FOMC Member Daily Speaks 23:30 – Fed Chair Powell Testifies
Wednesday, Jun 23, 2021 02:00 – API Weekly Crude Oil Stock 18:30 – FOMC Member Bowman Speaks 19:15 – Flash Manufacturing PMI | Flash Services PMI 20:00 – Crude Oil Inventories 20:30 – FOMC Member Basic Speaks
Thursday, Jun 24, 2021 18:00 – Final GDP q/q | Initial Jobless Claims
Is it a good time to take a long position in silver?
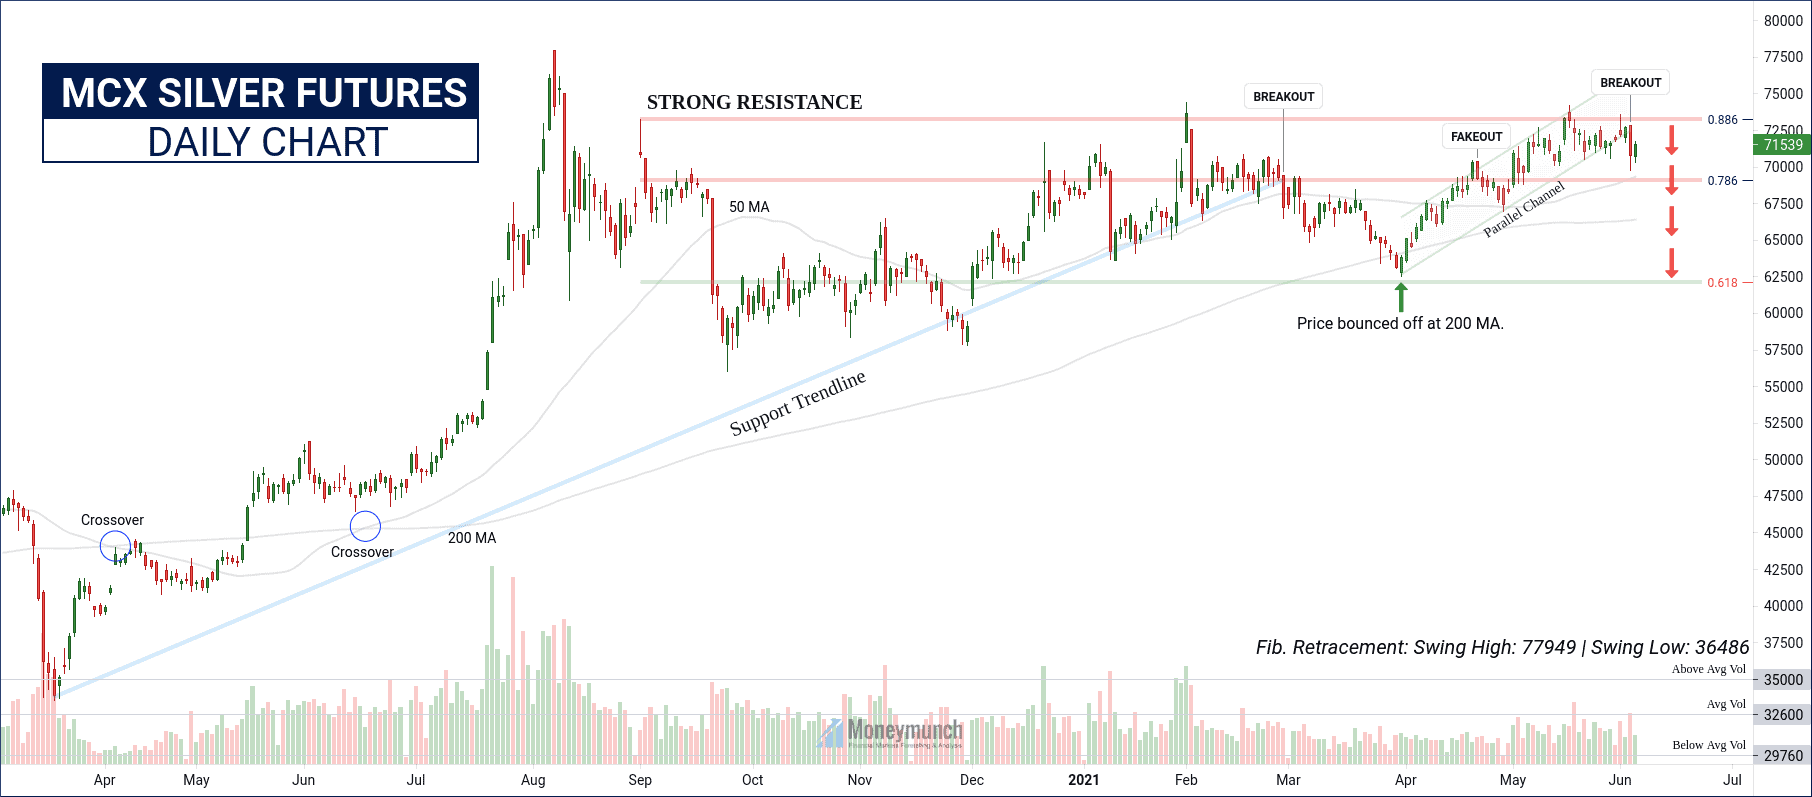
According to the previous data, it has breaks 2021’s support trendline. But the price has bounced off from the 200 moving average. And it’s not crossing the 0.886 value of retracement. Hence, at the present silver trading range is between 73222 – 69076 levels.
This week, silver may collapse up to 0.786 ( TP: 70660 – 70000 – 69200 ). And hurdle is 73222 level…
Unlock This Article
Only subscribers can read the full article. Please login to read the entire article.
To become a subscriber, subscribe to our free newsletter services. Our service is free for all.
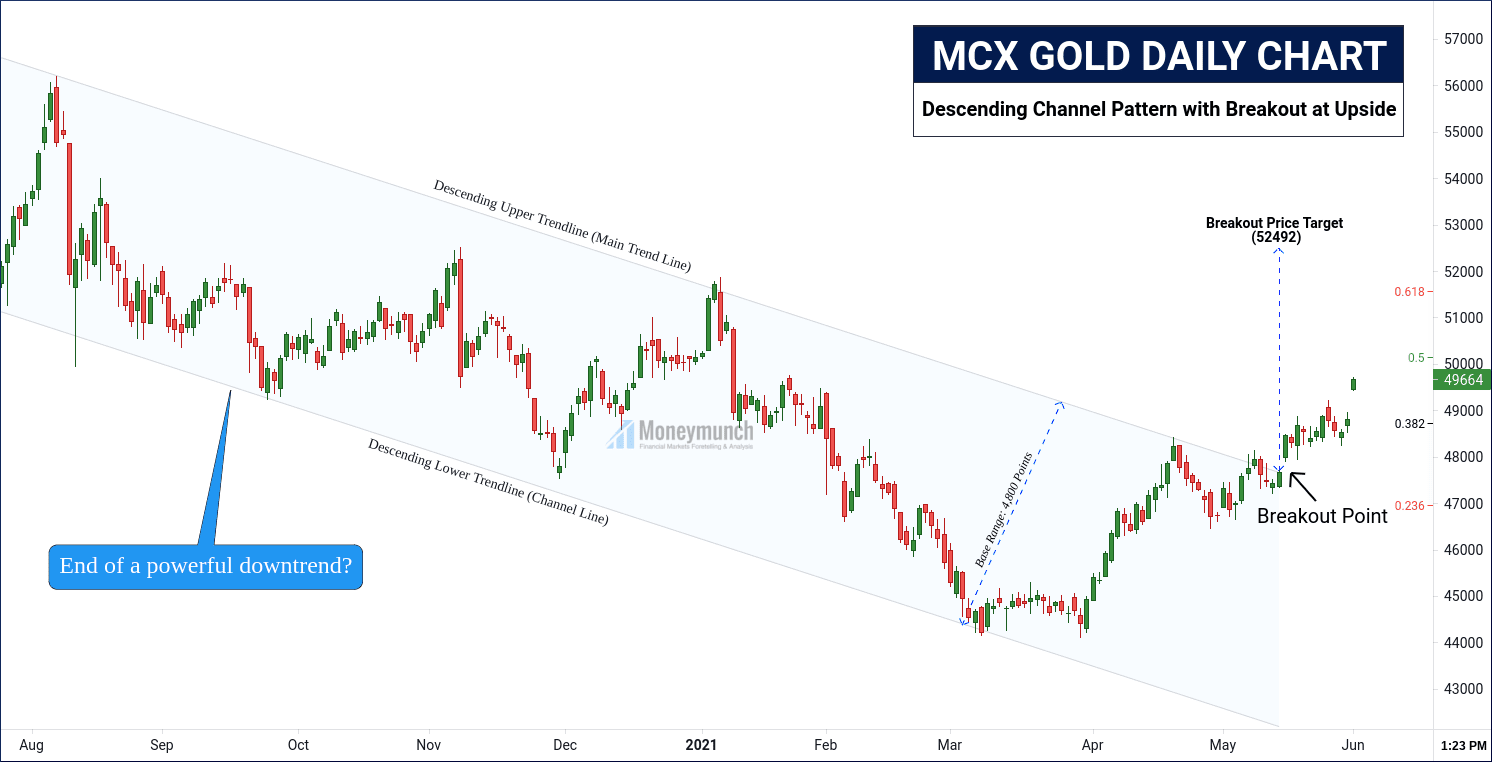
MCX gold will keep moving further advance up to the targets of 50000 – 51000 levels. But after the first target, gold will try to take a reversal for 0.382 to 0.236 levels of retracement.
Long-term Targets:51575 – 52492+
To become a subscriber, subscribe to our free newsletter services. Our service is free for all.
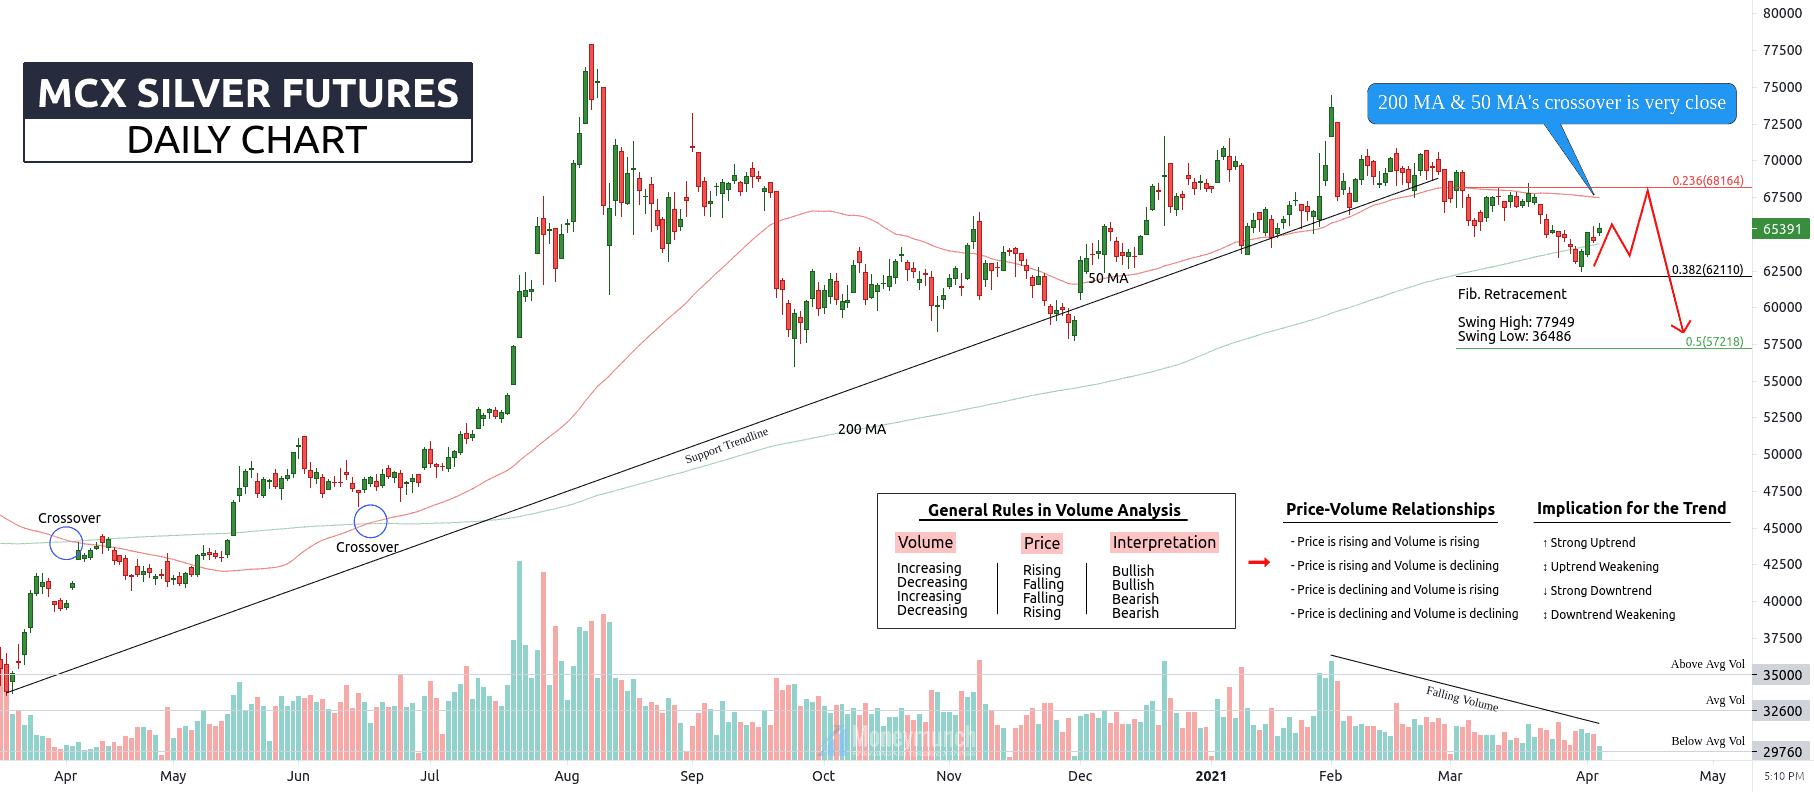
Volume accumulation is confirming a downtrend. Here, the price is in a downtrend. But if you look for the short-term, silver price has started rising nearby the retracement value of 0.382. We may see a bullish reversal from the 0.236 value for 0.382 to 0.5.
MCX silver futures prices may hike to the levels of 66000 – 66600 – 67000 – 68000.
Overall, a clear trend will identify after moving averages crossover.
I have written in clear words, “MCX gold will move upward gently this week. Hence, intraday traders can jump between the range of 45200 – 45300. Targets: 45560 – 45680“.
Gold has made a high of 45680 today at 5:24 PM and touched all targets. Approx. profit: Rs.38,000 per lot
To become a subscriber, subscribe to our free newsletter services. Our service is free for all.
 Unlock This Article