Today we have updated the short-term view of gold: Click here
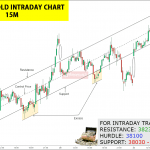
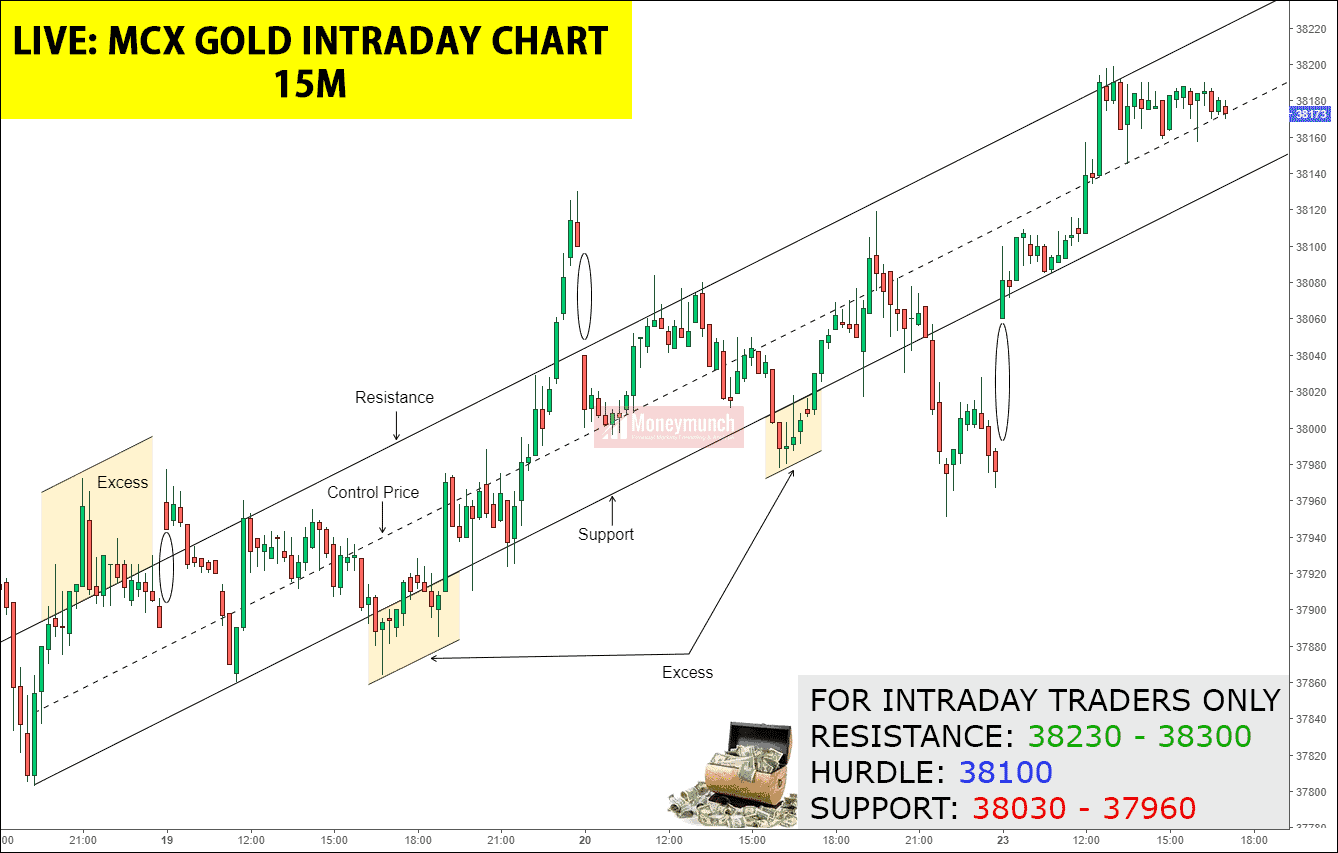
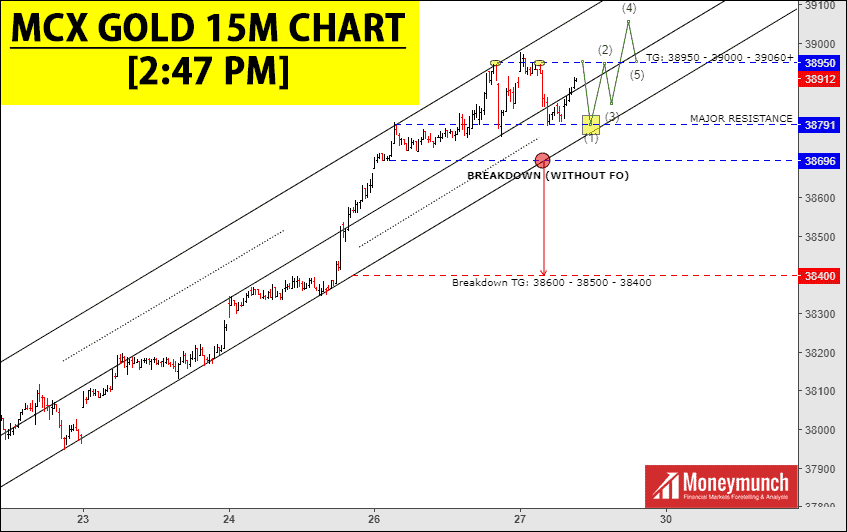
But what about Intraday? Look at the below chart:
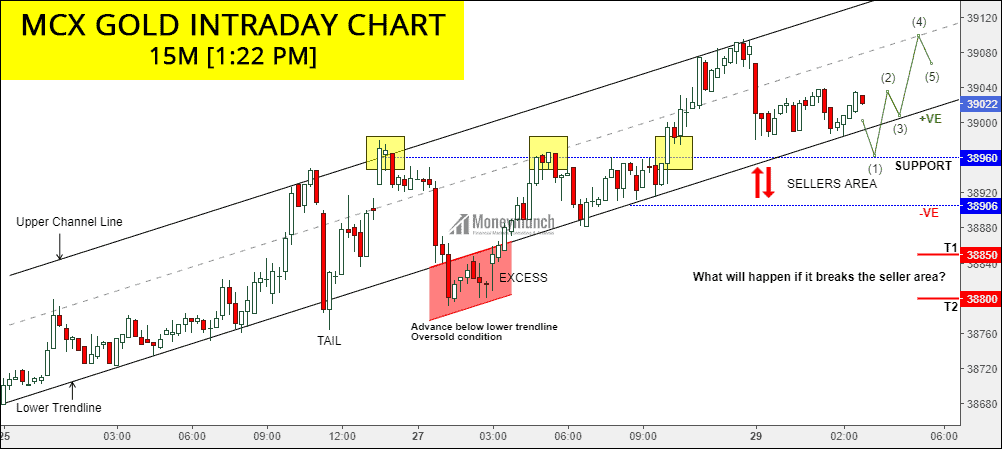
Today gold is positive up to 39080 – 39120+ levels.
As described on the chart, a breakout of the seller area falls the gold prices up to 38850 – 38800 levels.
To become a subscriber, subscribe to our free newsletter services. Our service is free for all.
Continue reading
 Unlock This Article