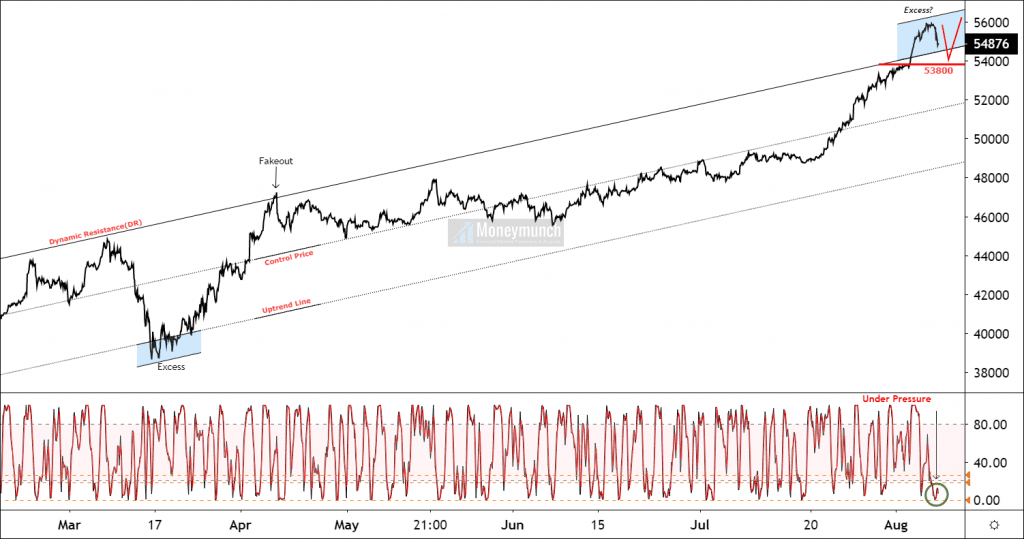
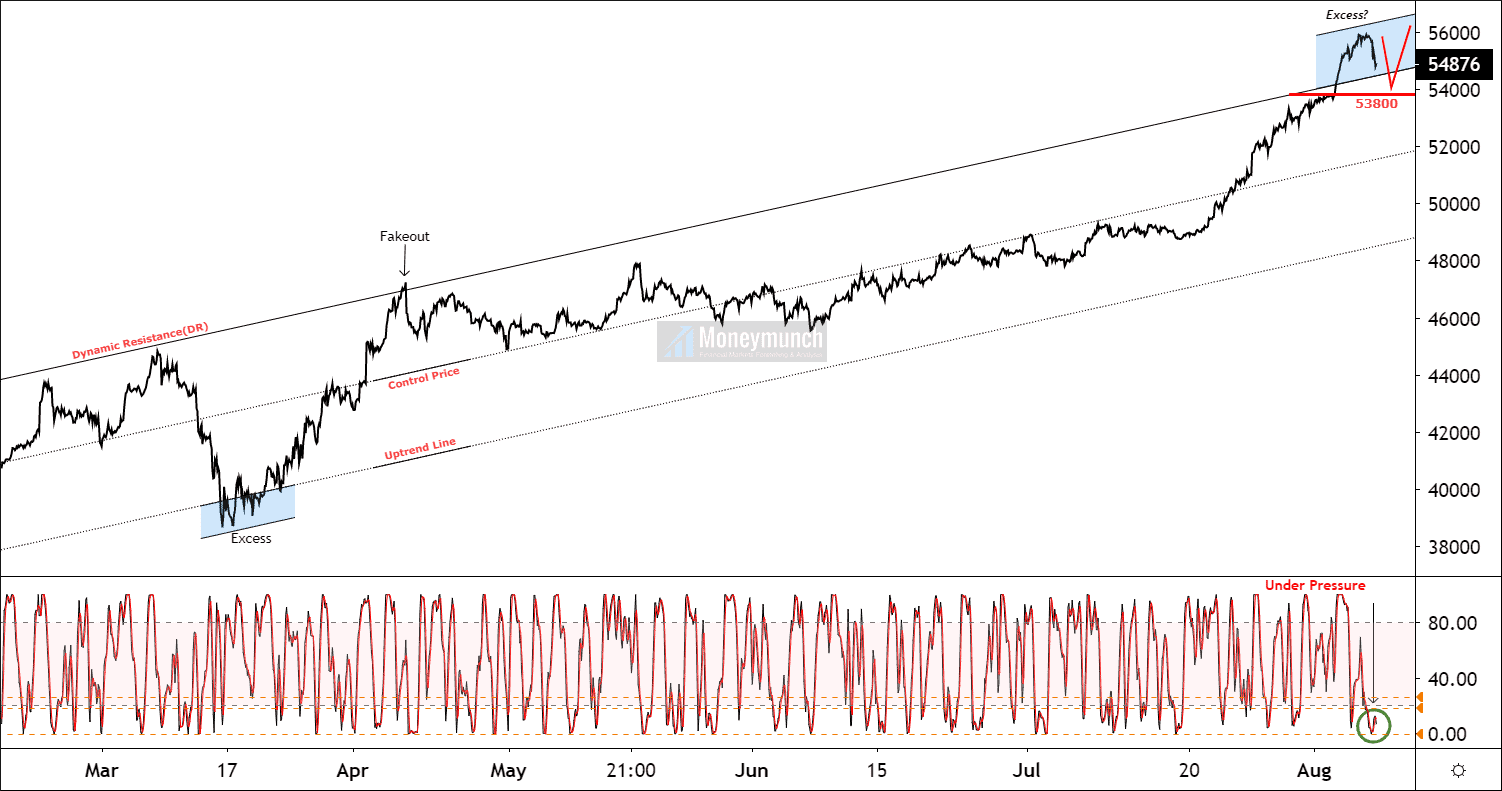
According to this chart, gold is reversing downward after making an all-time new high of 56191. Its support level is 53800. You can take this level as a hurdle too. We may see a correction up to this after the breakdown of DR.
This dynamic resistance will initiate buying pressure for a short period. We have chances to see 55600 (T1) to 56000+ (T2) levels.
Moreover, for short-term investors, I don’t recommend selling the gold until the breakout of my support. Intraday traders can enjoy price fluctuation, consolidation, and sideways movement.
To become a subscriber, subscribe to our free newsletter services. Our service is free for all.
Get free MCX ideas, chart setups, and analysis for the upcoming session: Commodity Tips →
Have you any questions/feedback about this article? Please leave your queries in the comment box for answers.
Is it daily chart?
No, that’s an hourly chart.
Sir what about silver chart?
I’m going to do cash deposit tomorrow. Is it okay sir? offer is open na?
Yes, you can make the payment through cash deposit. Special offers will remain available on MCX plans for a short period. We will announce the closing date & time soon. Thank you!