Will bull traders drive Apollotyer above Rs.300?
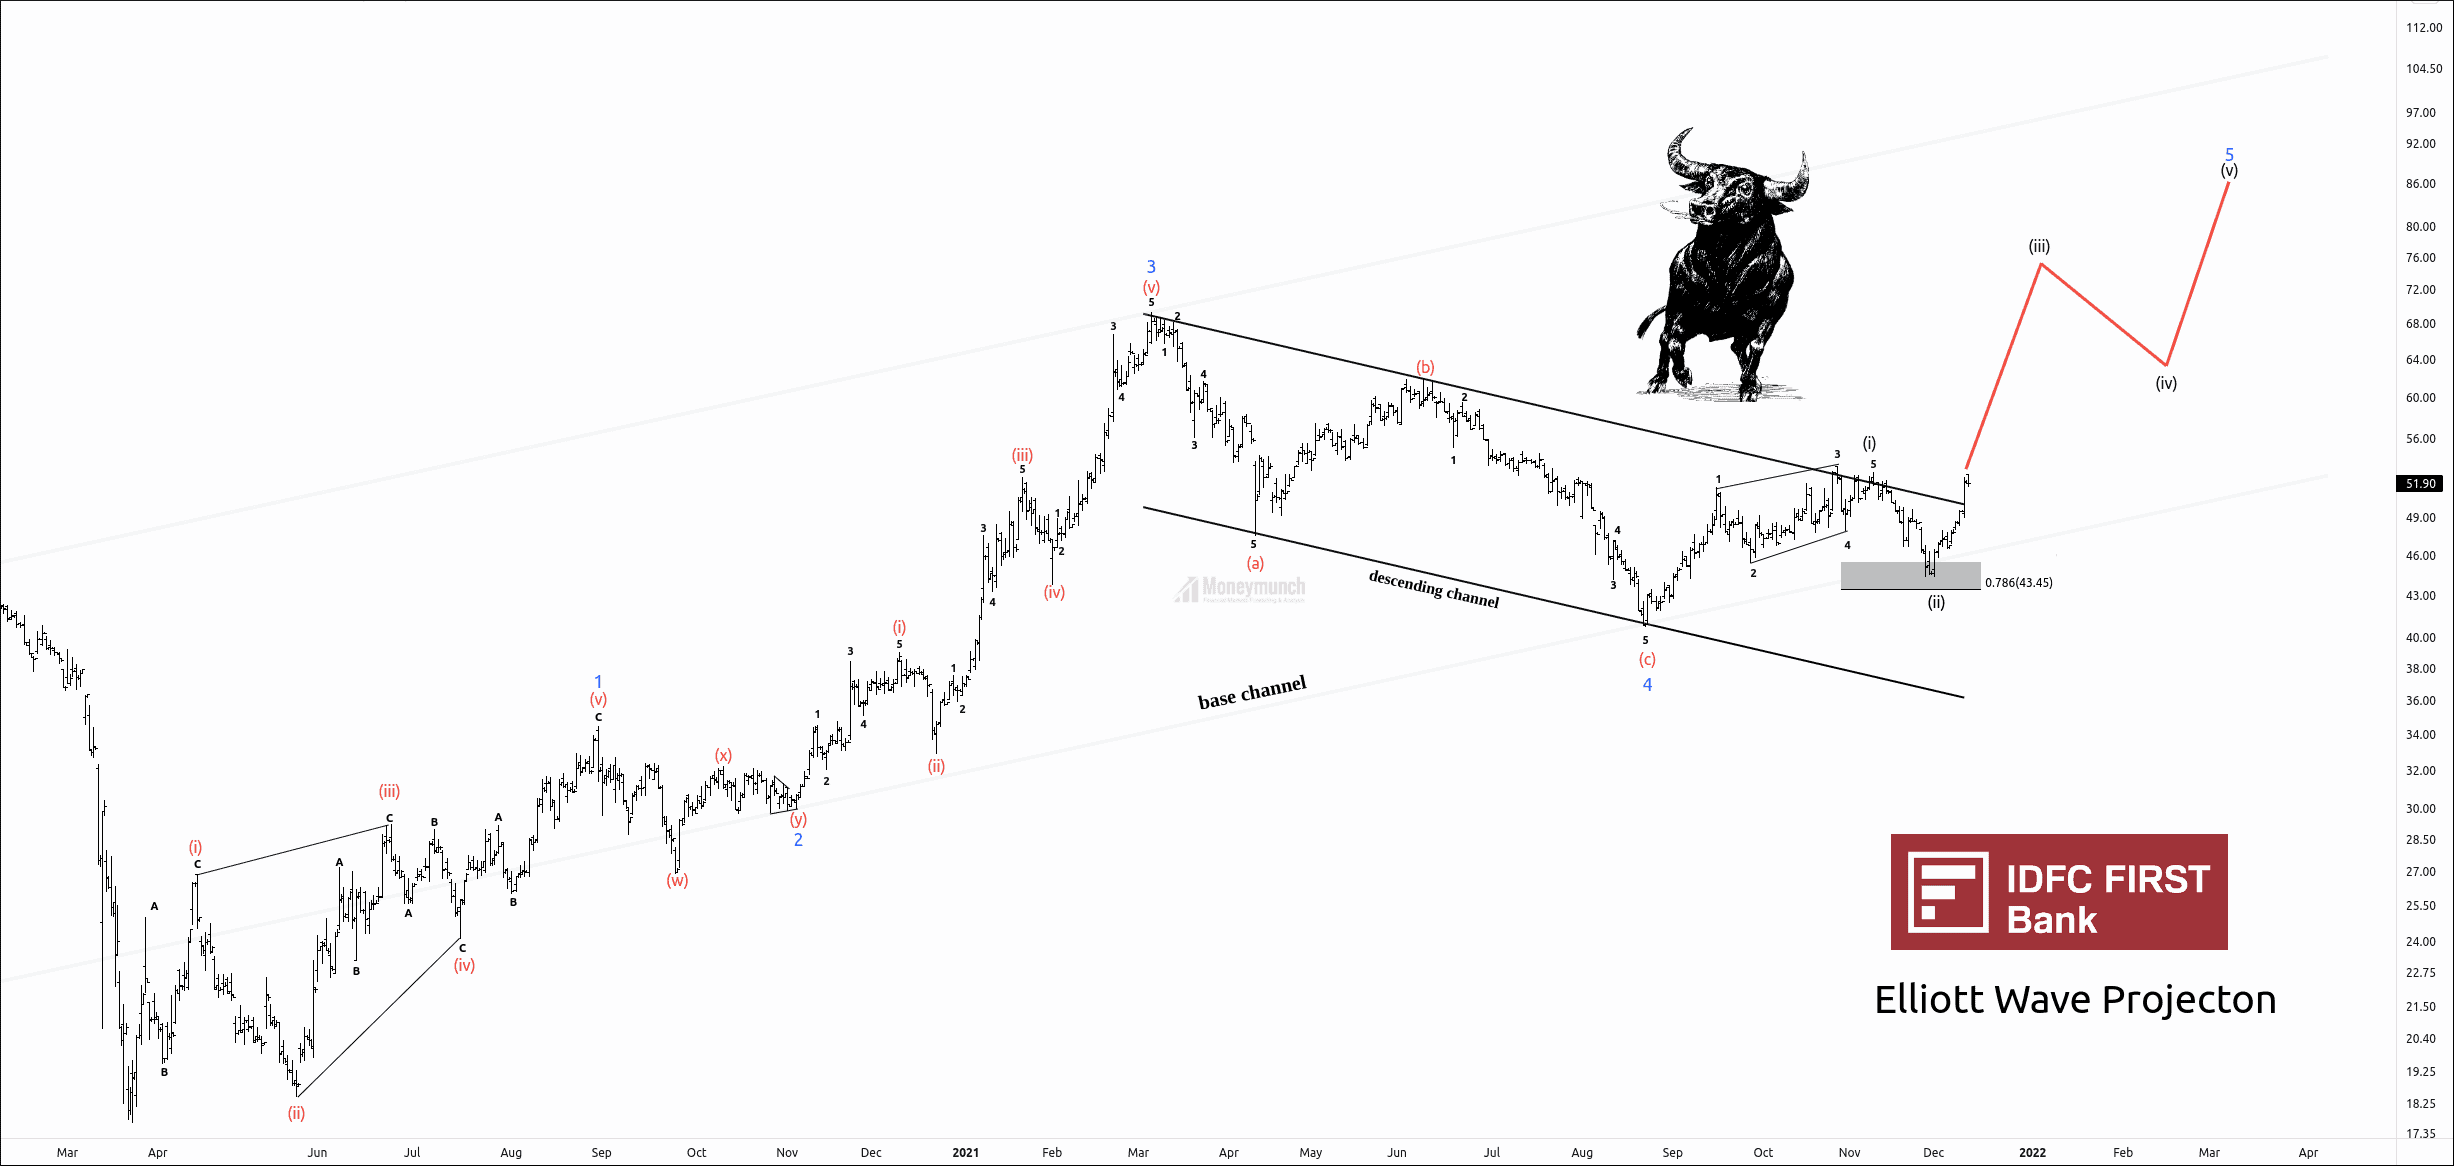
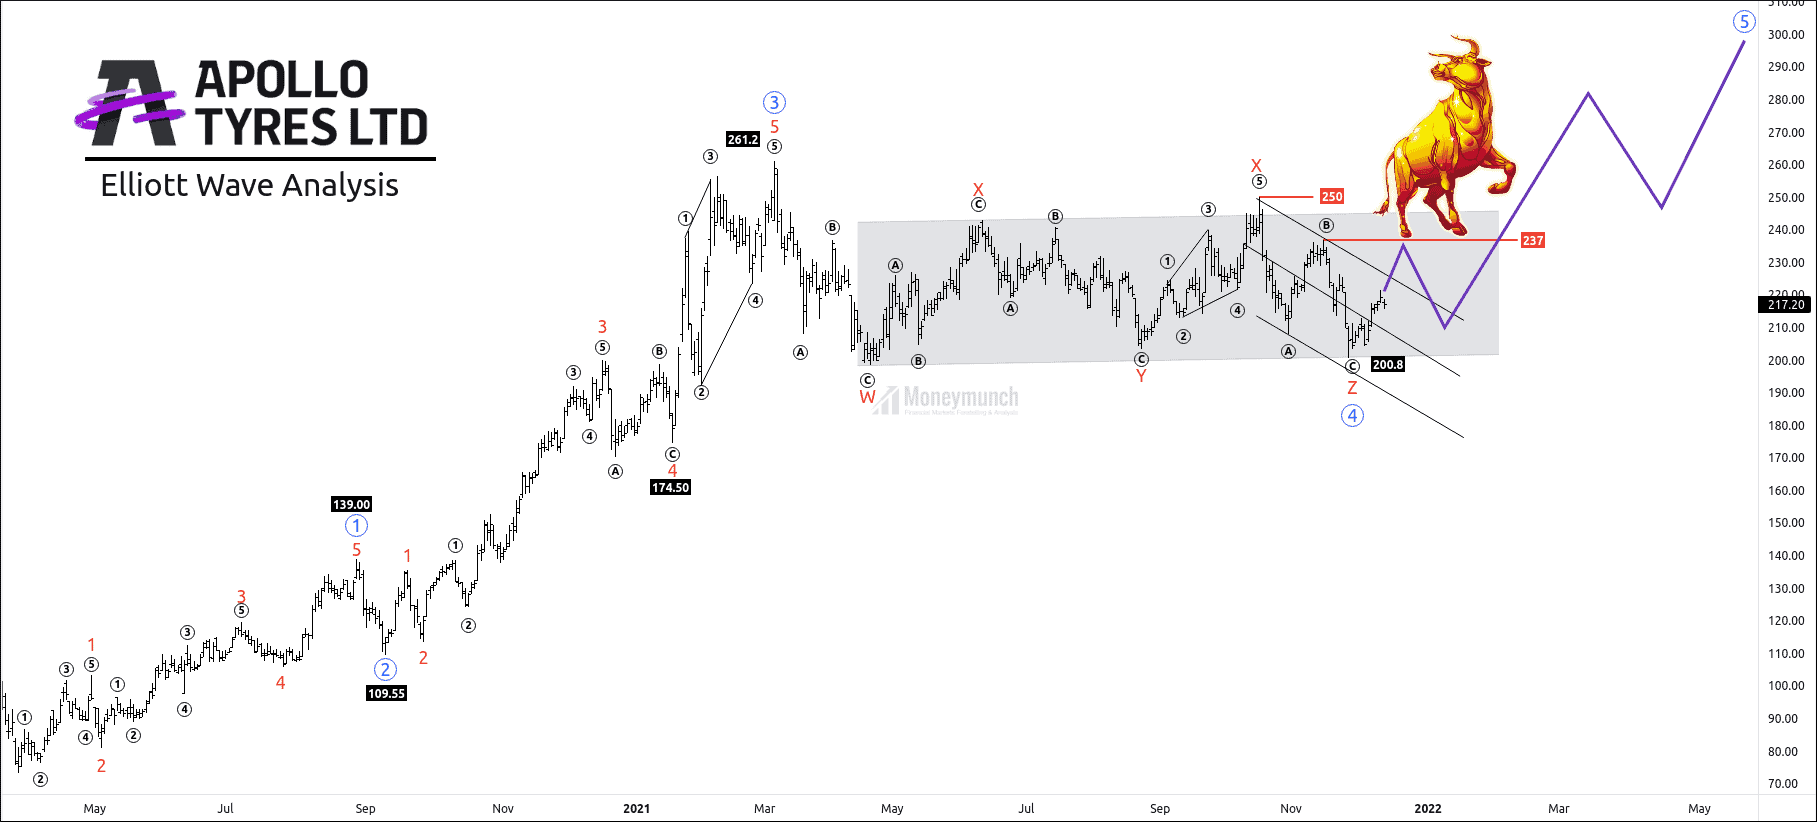
APOLLOTYER is preparing for a bull run. After completion of the 3rd wave at 261.2. Price had started a corrective wave ((4)) and took 38 weeks to finish this structure.
A trader can trade impulsive wave ((5)) to make a high confidence trade setup.
Wave Formations and Fibonacci relationships:
Wave ((1))is an impulse with a 5-3-5-3-5 wave structure.
Wave ((2)) is a zigzag move. Fibonacci retracement of wave 2 is 50% of 1st impulsive wave at 109.55. Sub-wave of wave 2 fulfilled the rule of equality (wave A= wave C)
Wave ((2)) is not exceeding the starting point of wave 1.
Wave ((3)) is an extensive impulse. 3rd wave has 261.8% retracement of 1st impulsive at 261.
Wave ((4)) is a triple three with a 3-3-3-3-3 wave structure.
It retraced 38.2% of the 3rd wave and did not overlap the starting point of wave 1.
What will happen next?
Completion of sub-wave z indicates that the corrective wave has ended. Price has started forming sub-waves of wave 5.
The sub-wave z of wave ((4)) has formed a descending channel.
If the price breaks descending channel and close above sub-wave ((b)) at 237, it will confirm the impulsive behavior.
(Note that the ending point of the corrective wave is the starting point of an impulsive wave.)
A trader can expect the following targets: 237 – 250 – 279 – 297+
Target 1: 237
[Clusters: high of wave B, the breaking point of the channel, 61.8% of reverse Fibonacci retracement of wave 4]
Target 2: 250
[Clusters: 78.6% reverse Fibonacci retracement of wave 4, high of wave X]
Target 3: 279
[Clusters: 38.2% of reverse Fibonacci retracement of wave 4, 50% Fibonacci extension of wave 1 through 3]
Target 4: 297+
[Clusters:161.8% of reverse Fibonacci retracement of wave 4, 50% Fibonacci extension of wave 1 through 3]
The safe traders can wait for the breakout of wave X.
If the price fails to break the wave X, correction is about to make a new leg down.
They can enter on the pullback to enter where they can manage risk with tight stop loss.
Invalidation: pullback can’t break the low of wave ((4))
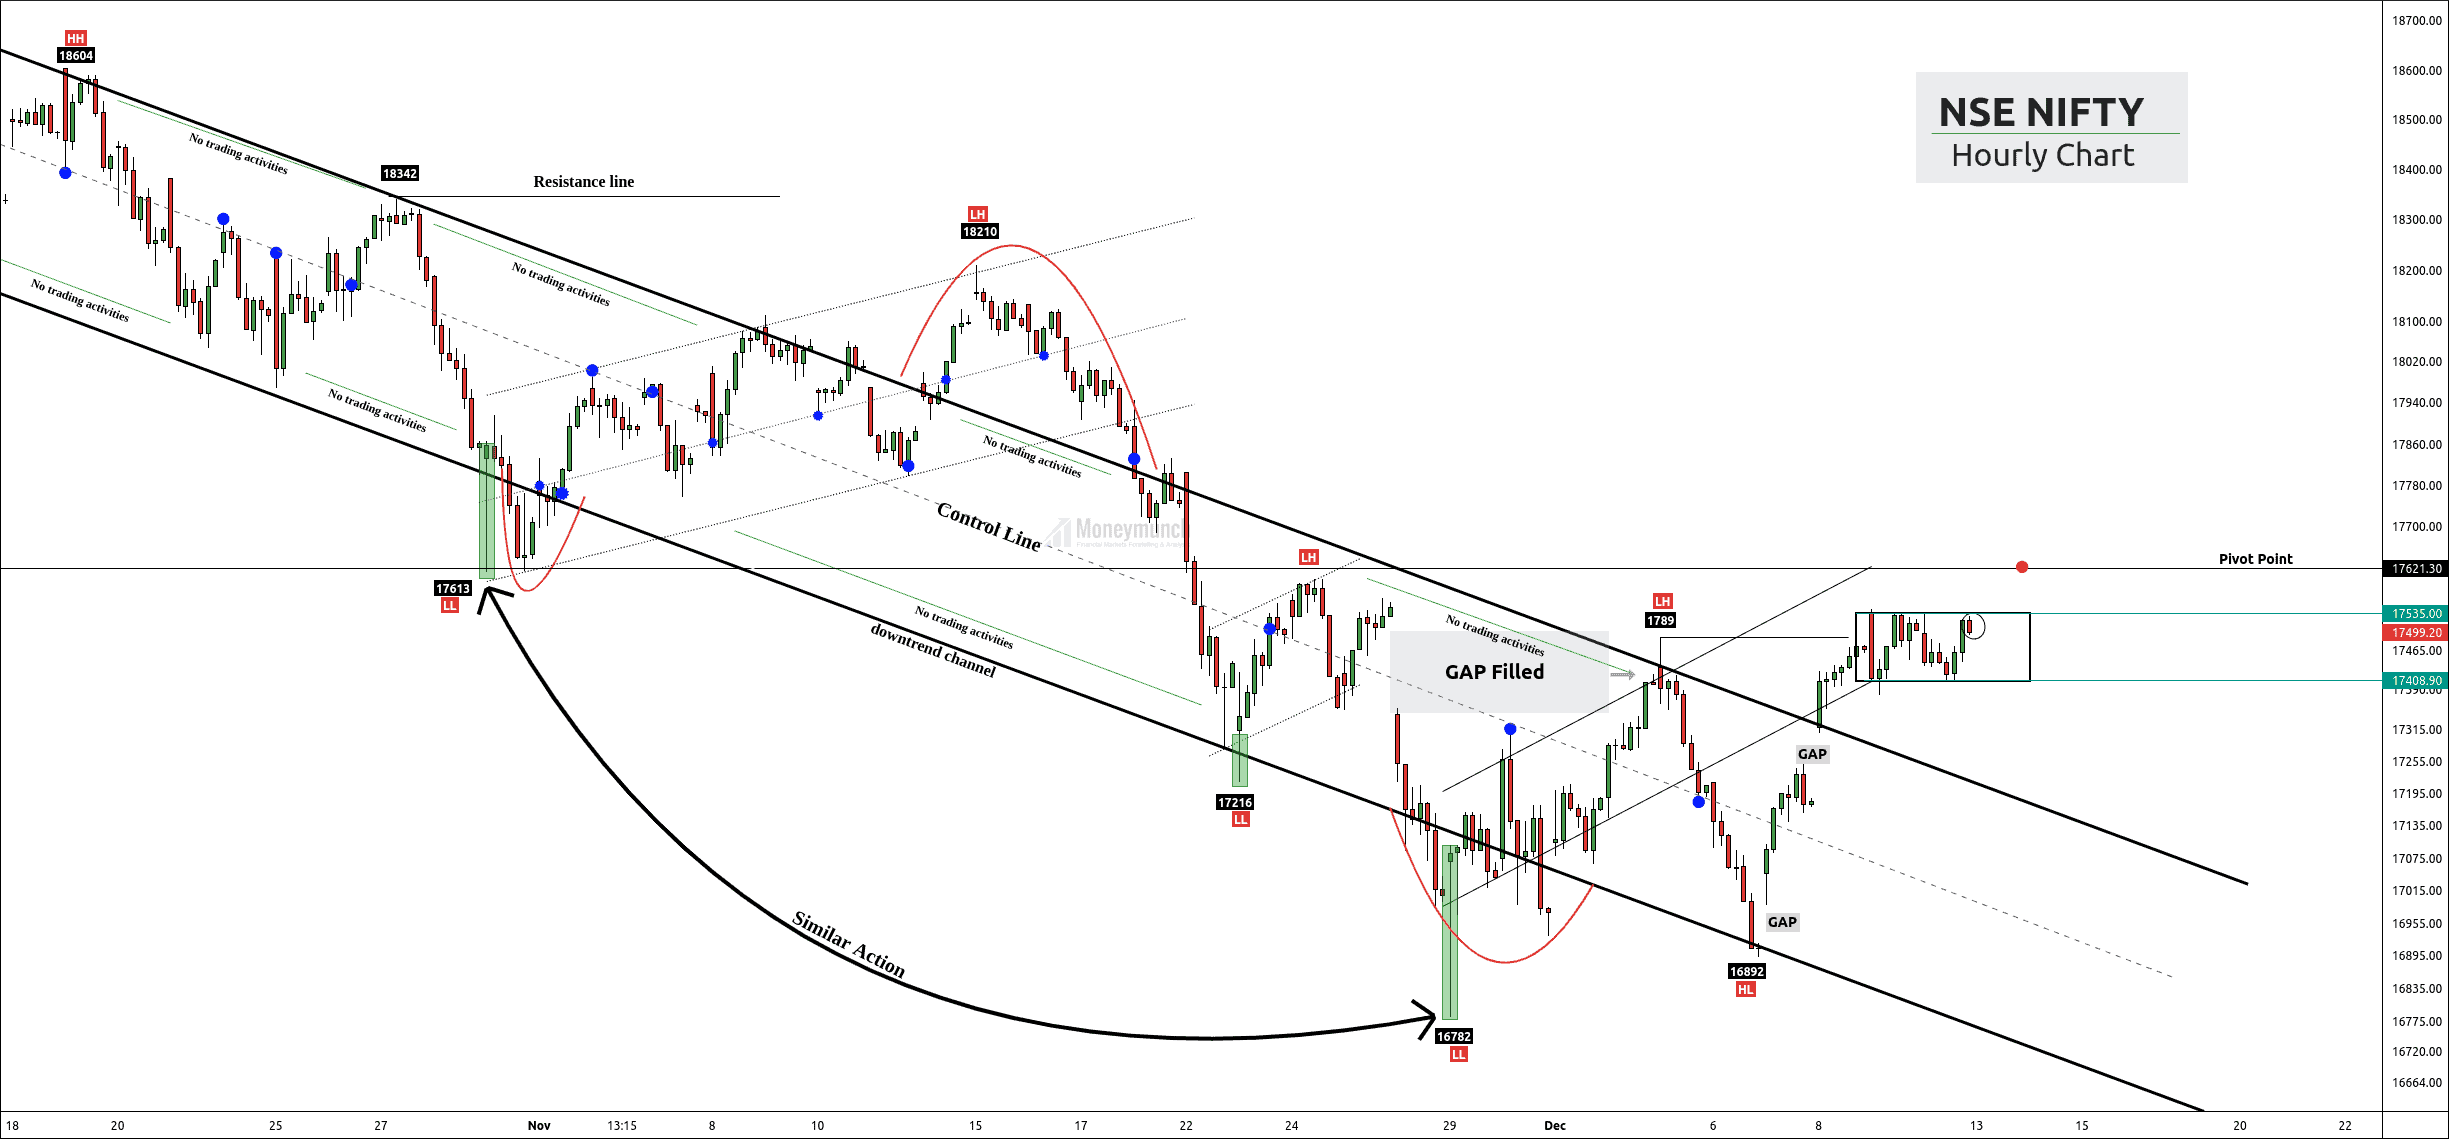
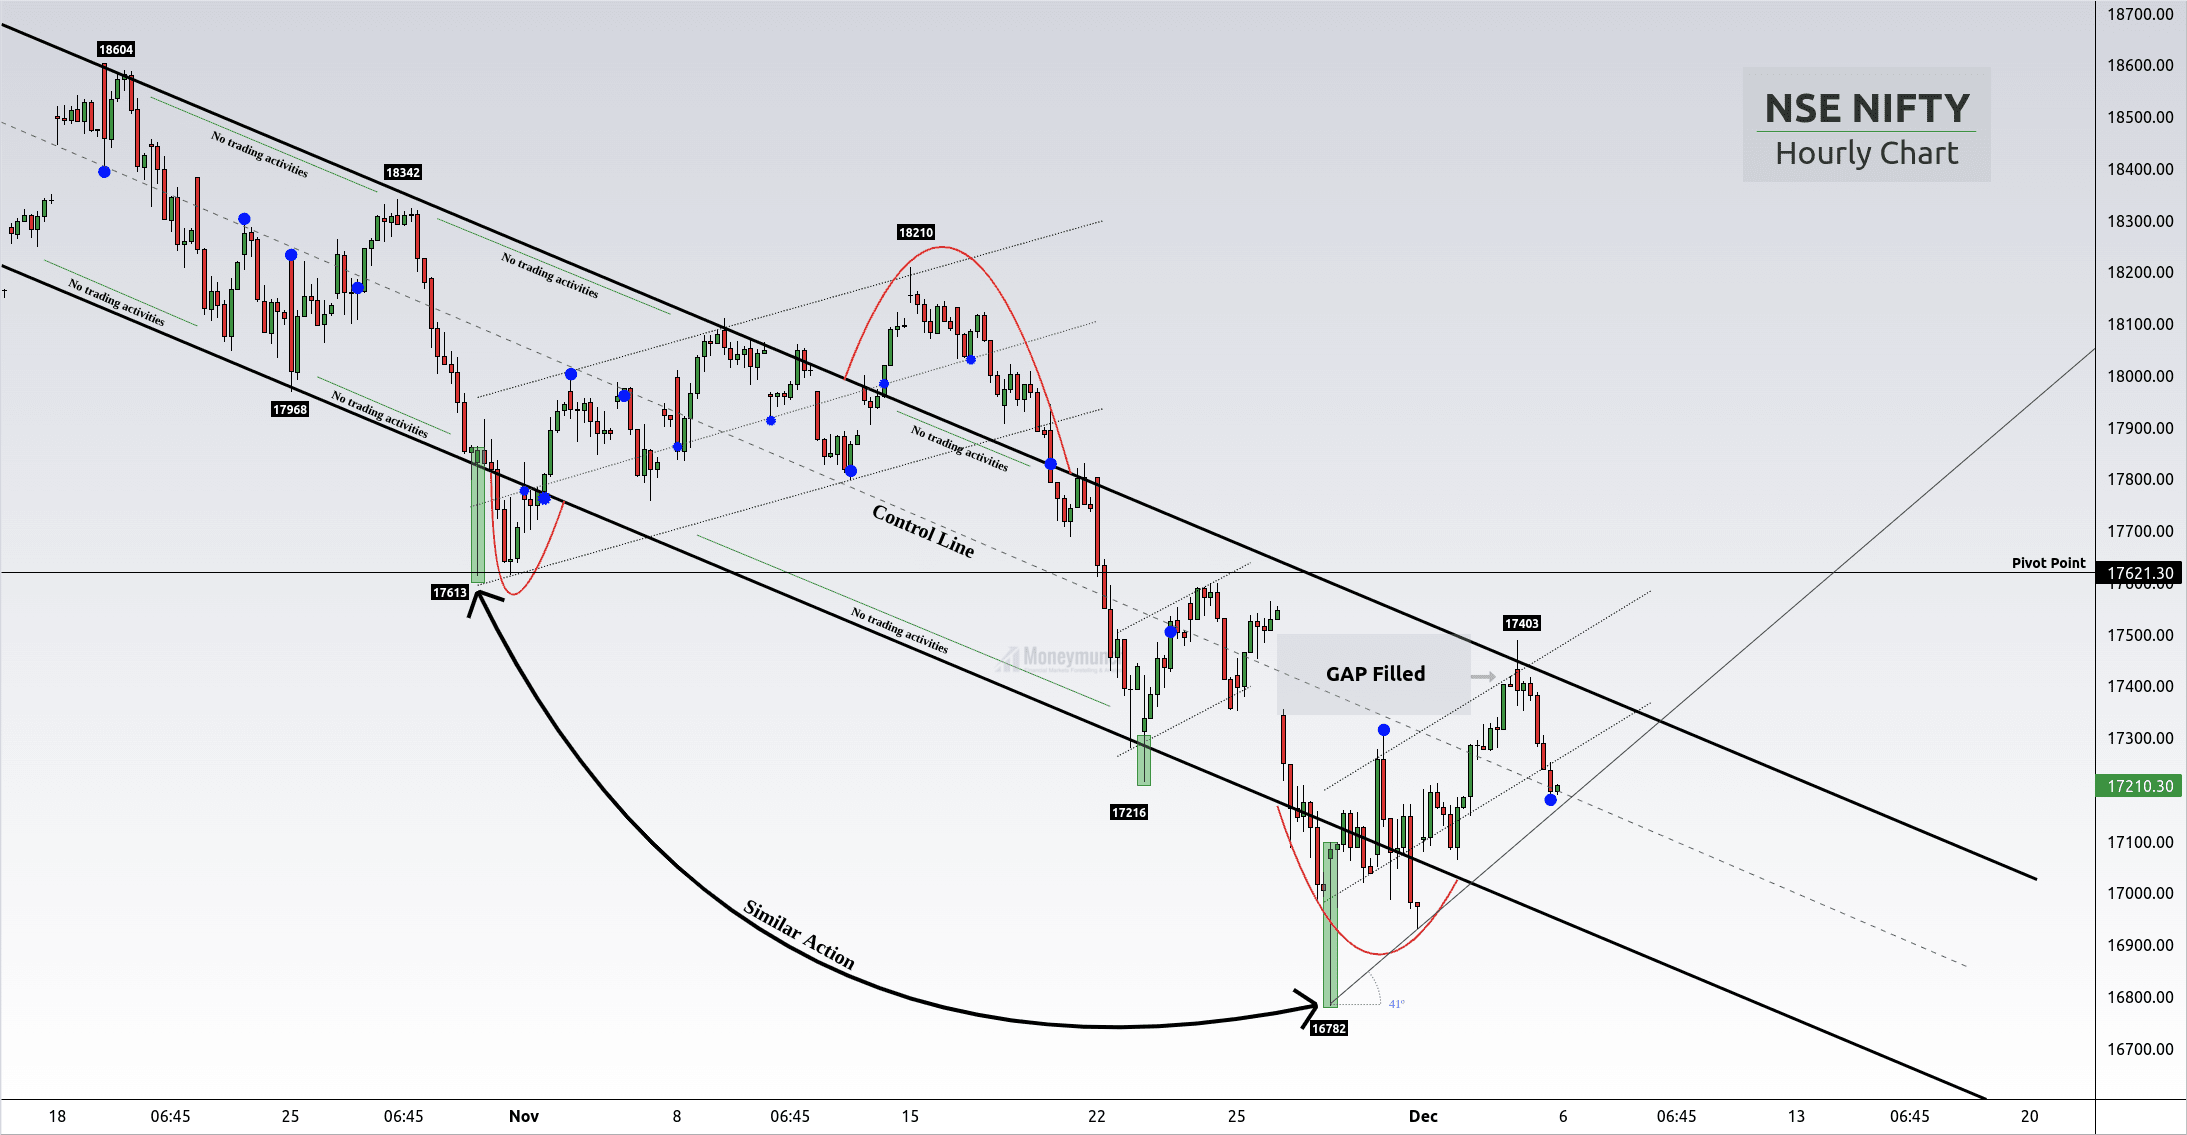
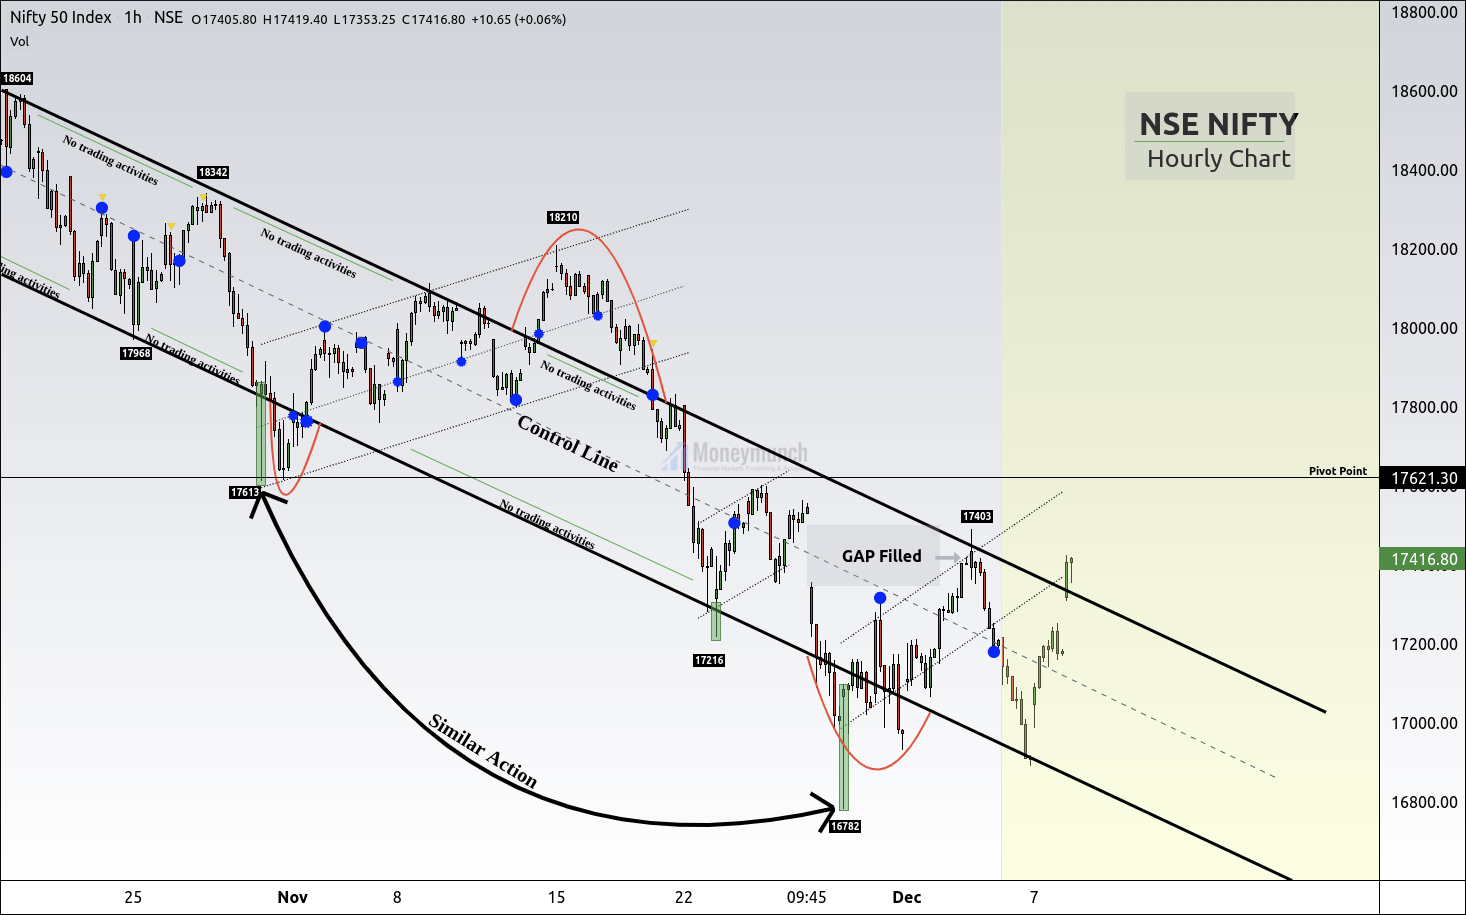
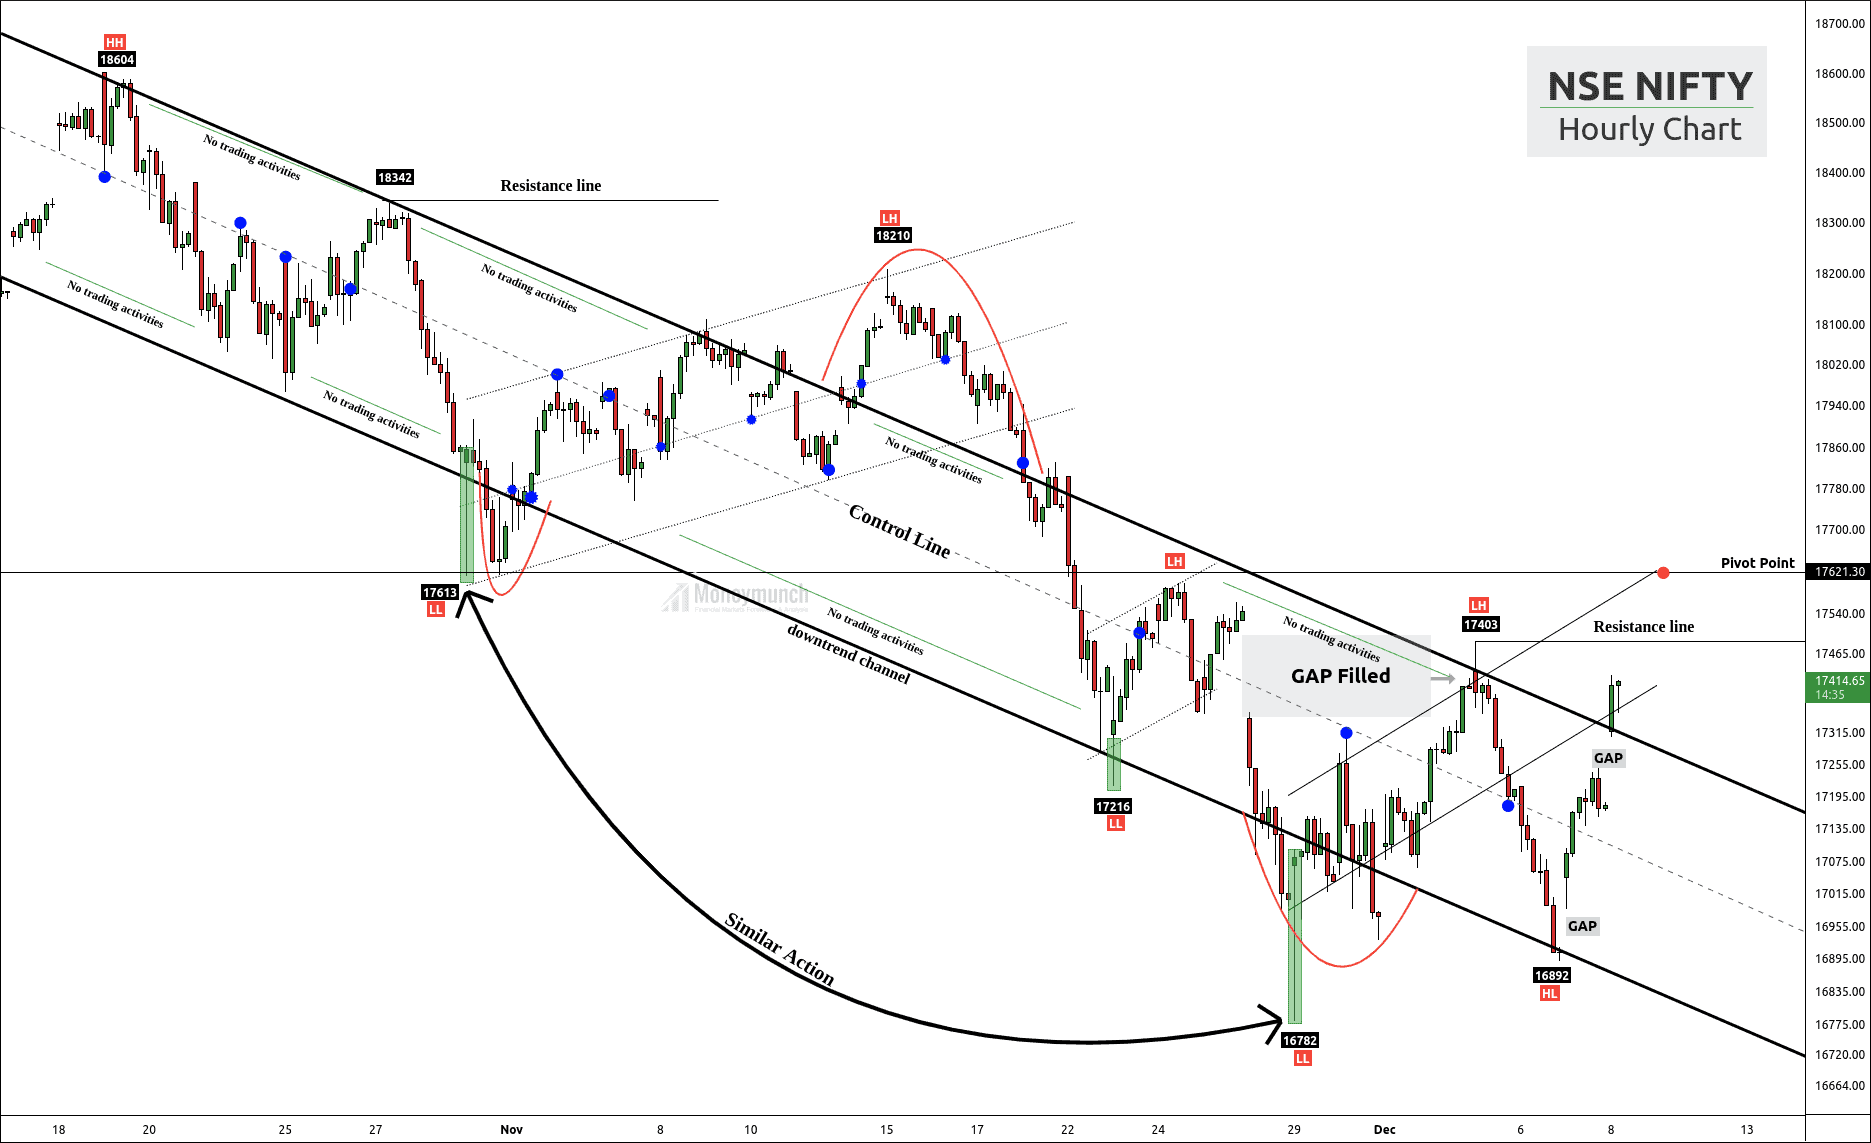
NIFTY UPDATE
Nifty has exactly performed as I described on the 13 Dec hourly chart. First, click the below link to read that Nifty Tips again:
Nifty is technically short-term bullish, but
First, nifty has touched the first three upside targets on the same day. And It has started collapsing to break downward targets of 17465-17408-17312.
Today nifty has made a low of 17225.8 and completed all targets. What’s next? I will update you soon.
To become a subscriber, subscribe to our free newsletter services. Our service is free for all.
 Unlock This Article