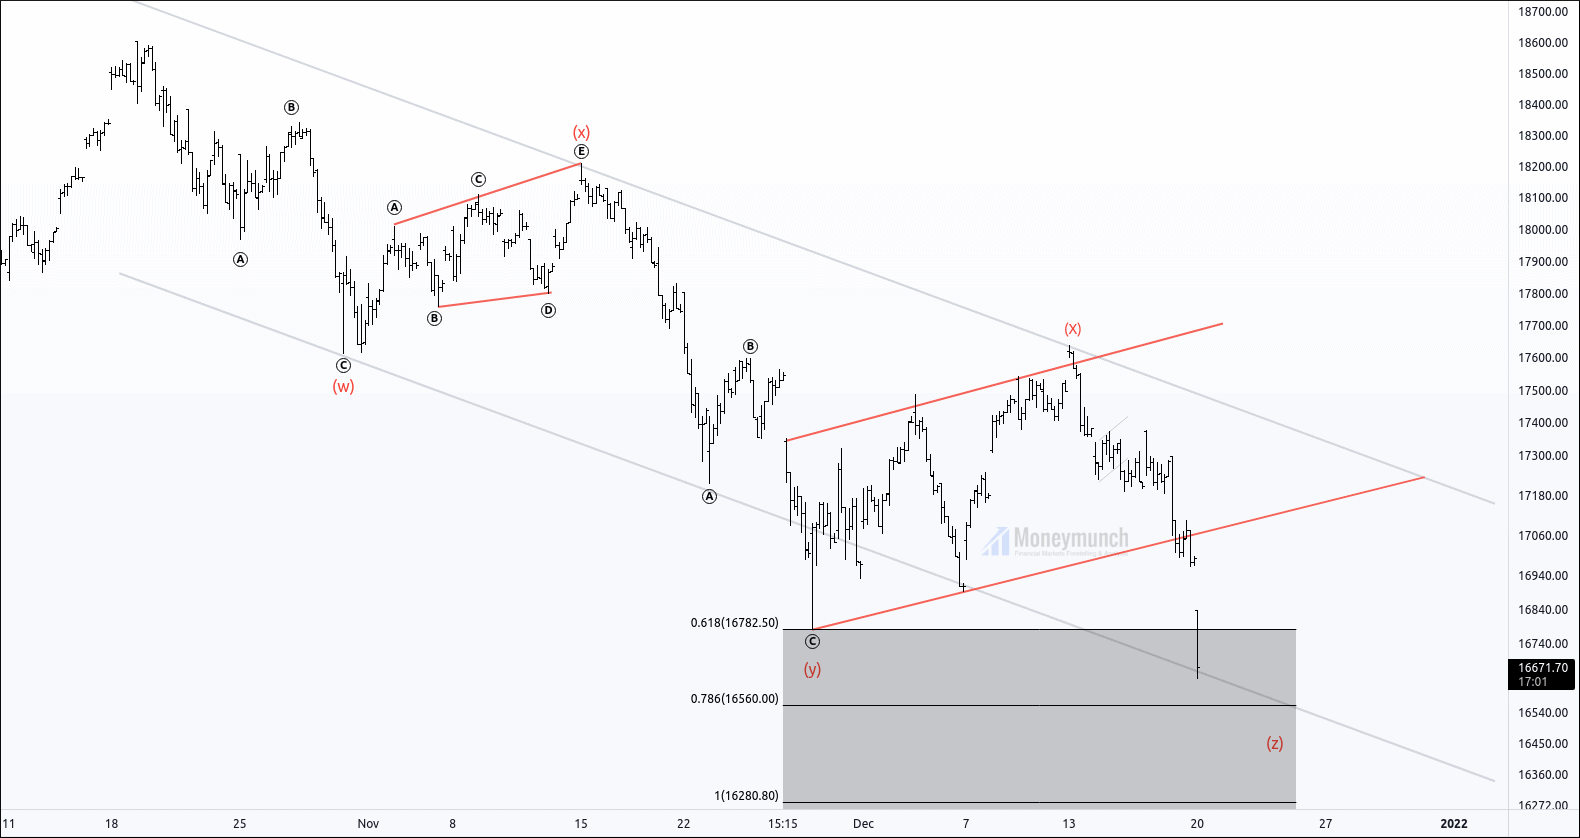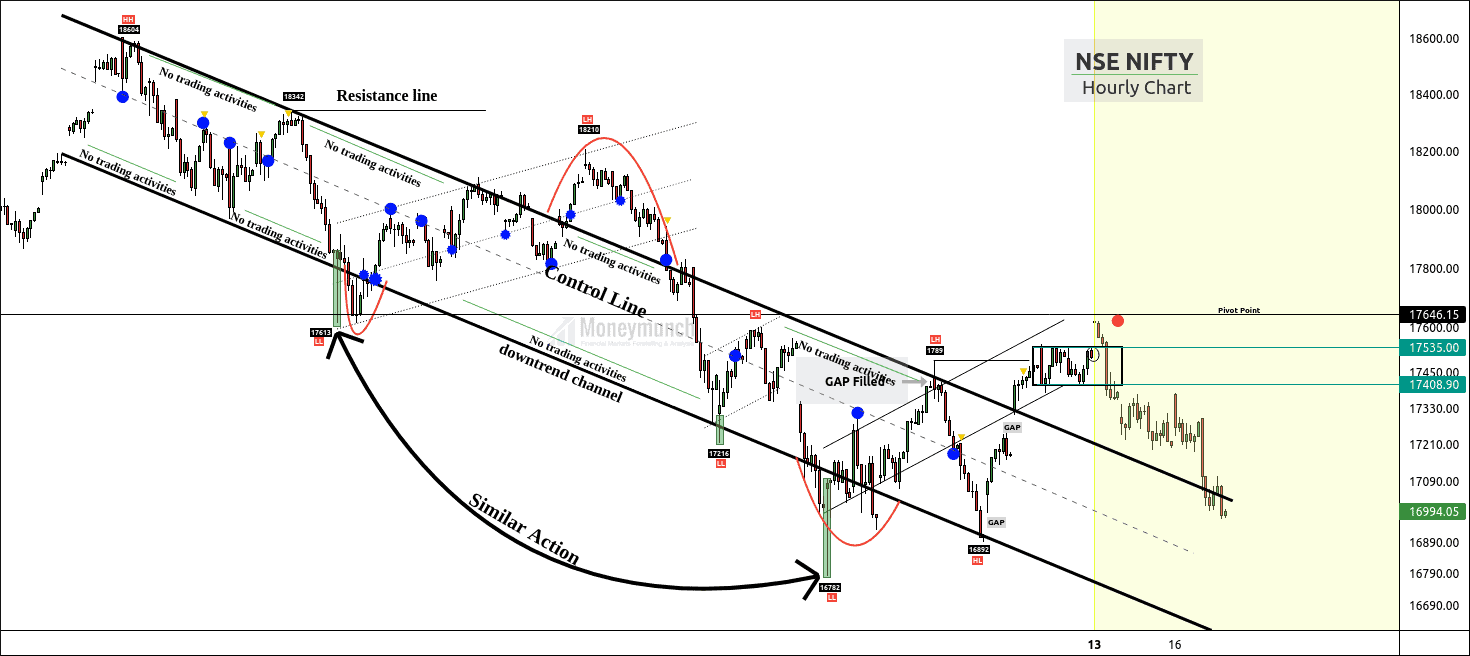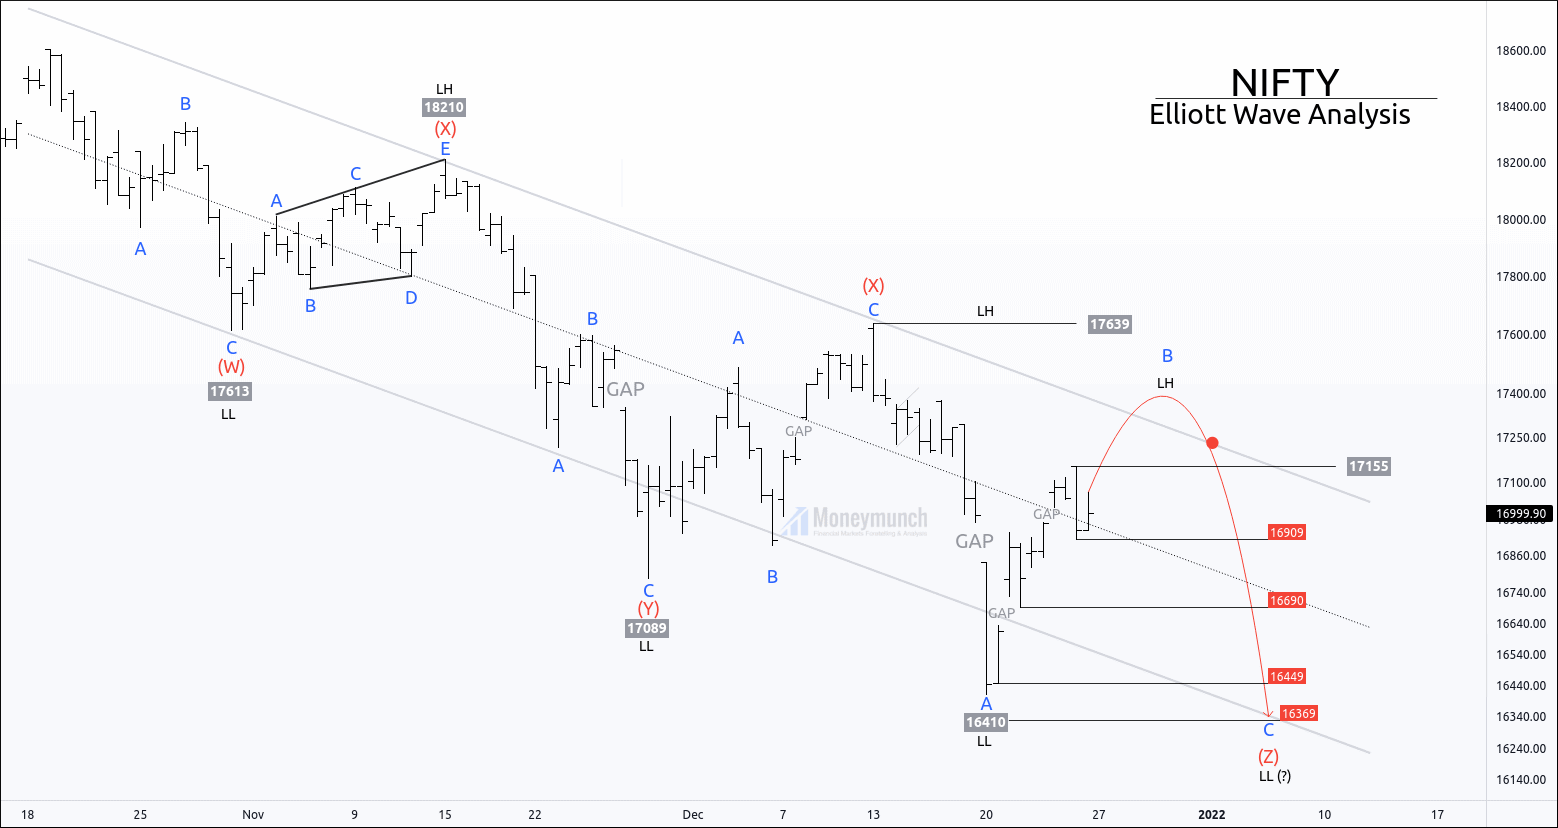
Nifty is constructing triple three (X,Y,Z) right now.
Price is about to accomplish sub-wave B of triple three.
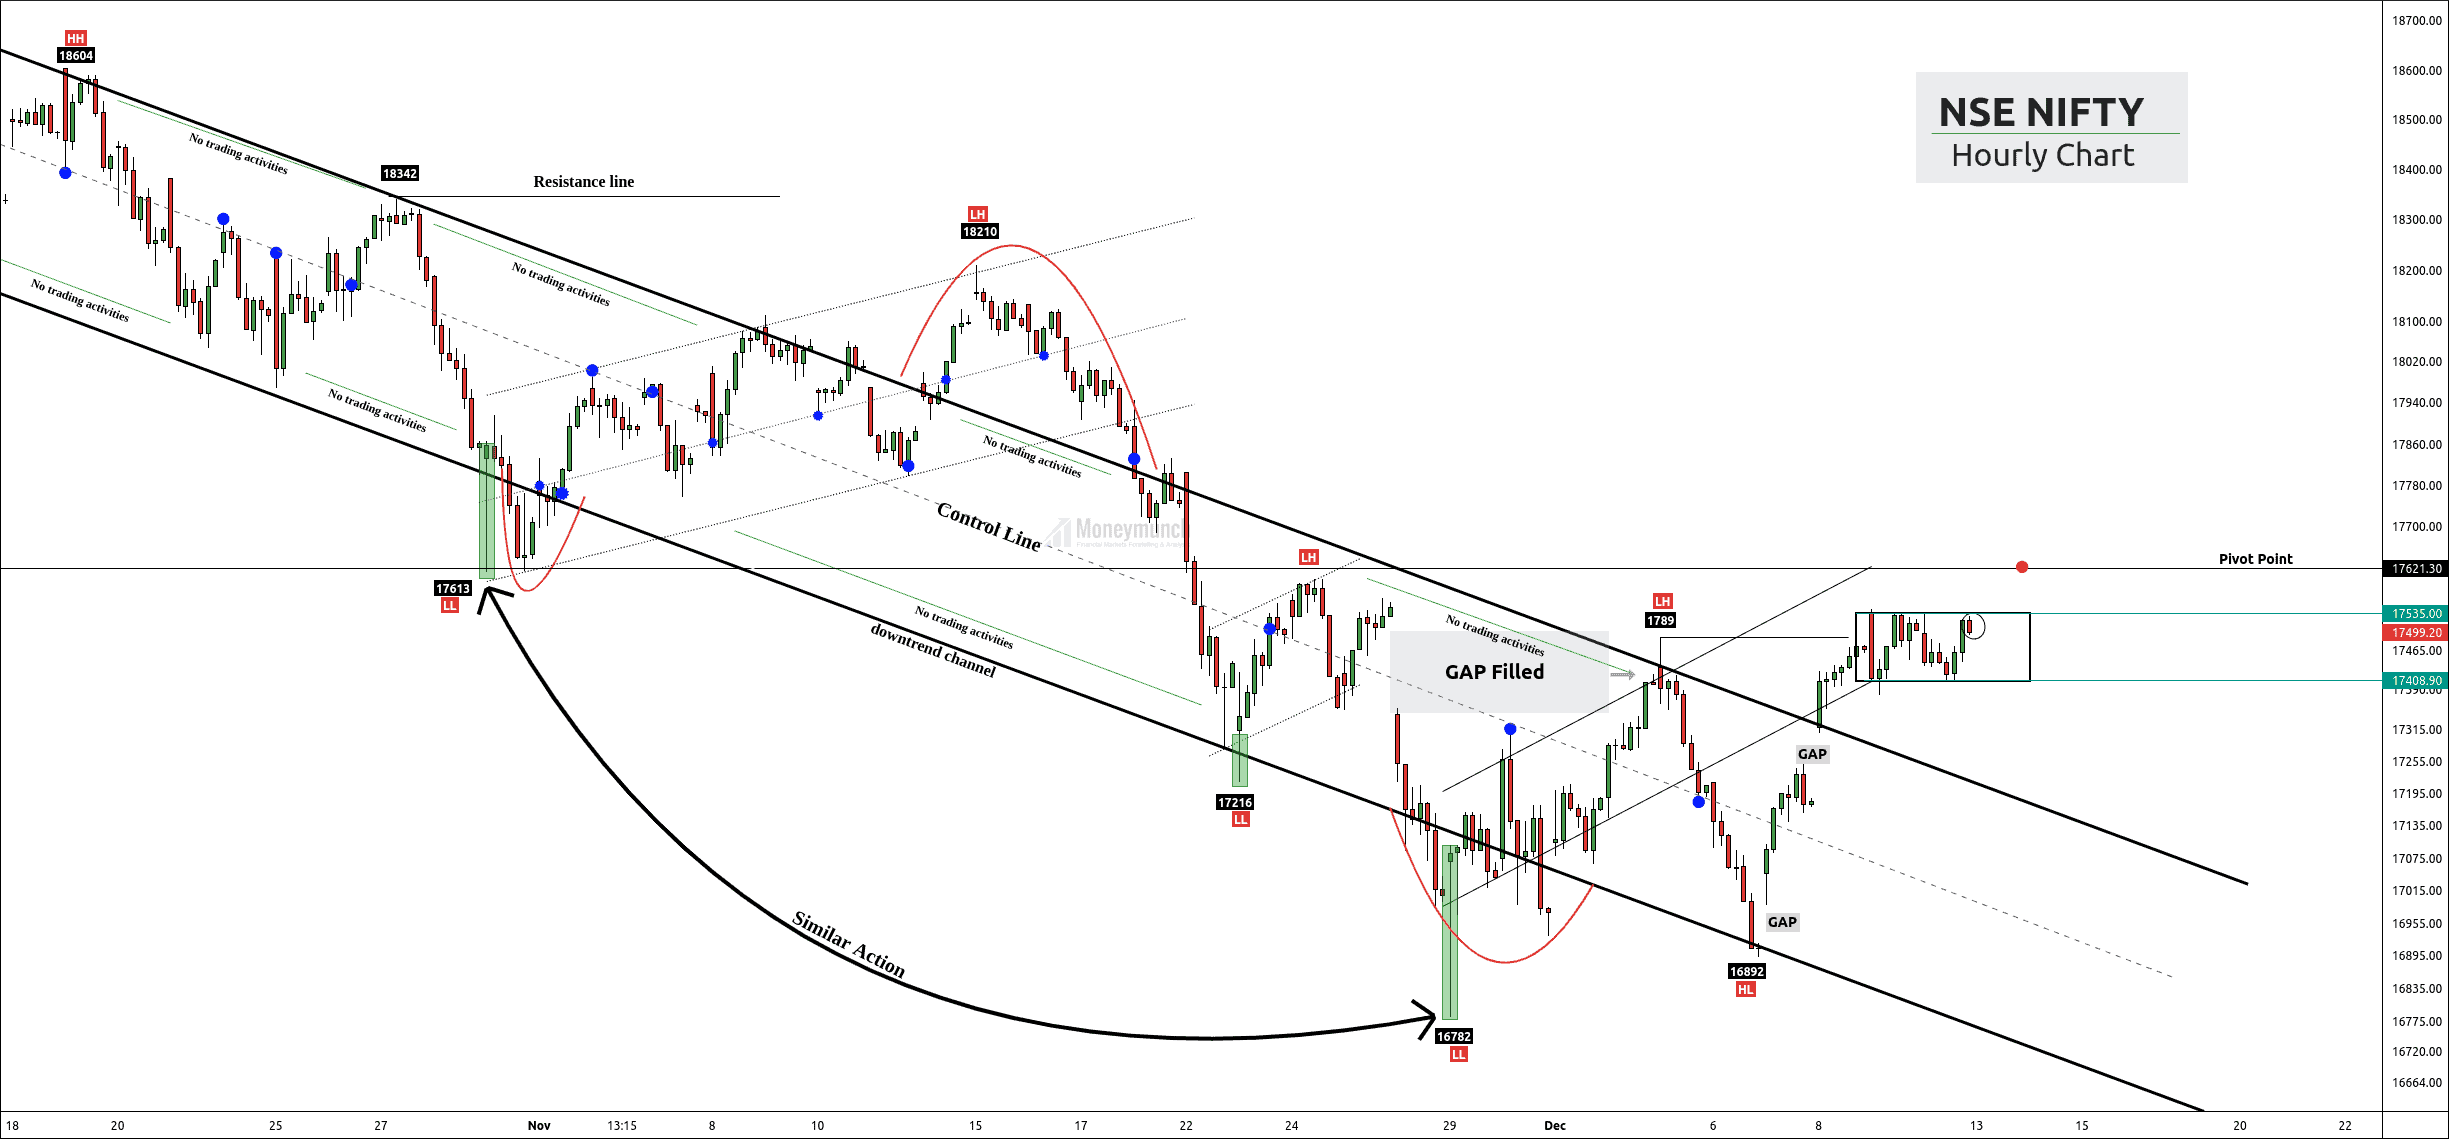
Buyers should be ready to exit from their position before the price reaches the nearest lower high at 17639, which is wave (X) of the correction.
According to wave principle, if the price couldn’t sustain above wave X, then the current trend is about to resume.
Currently, nifty’s trend is bearish and, wave C can give a downward motion with the following targets:16909 – 16690 – 16449 – 16369.
Note that price can make an excess at the upper band of the channel.
Trade Setups (only for the safe traders):
Traders can enter when the price rejects the wave (X).
If the price breaks the (X) at 17639, it may be a fake-out. Traders can wait for the price to enter into the parallel channel.
Stop can be the nearest high of the excess which will be out of the channel.
Trade Setups (only for the Lionheart traders):
Lionheart traders can enter in sell position when the price makes rejection of wave (X).
After the price rejection, they can initiate a short position below 17600.
Stop can be high of the new lower high.
To become a subscriber, subscribe to our free newsletter services. Our service is free for all.
 Unlock This Article