 Unlock This Article
Only subscribers can read the full article. Please login to read the entire article.
To become a subscriber, subscribe to our free newsletter services. Our service is free for all.
Continue reading

Get free share market NSE & BSE stocks, cash equity, futures, options, and all nifty trading tips and market research reports that enhance your knowledge and take your trading game to the next level.
To become a subscriber, subscribe to our free newsletter services. Our service is free for all.
Before:
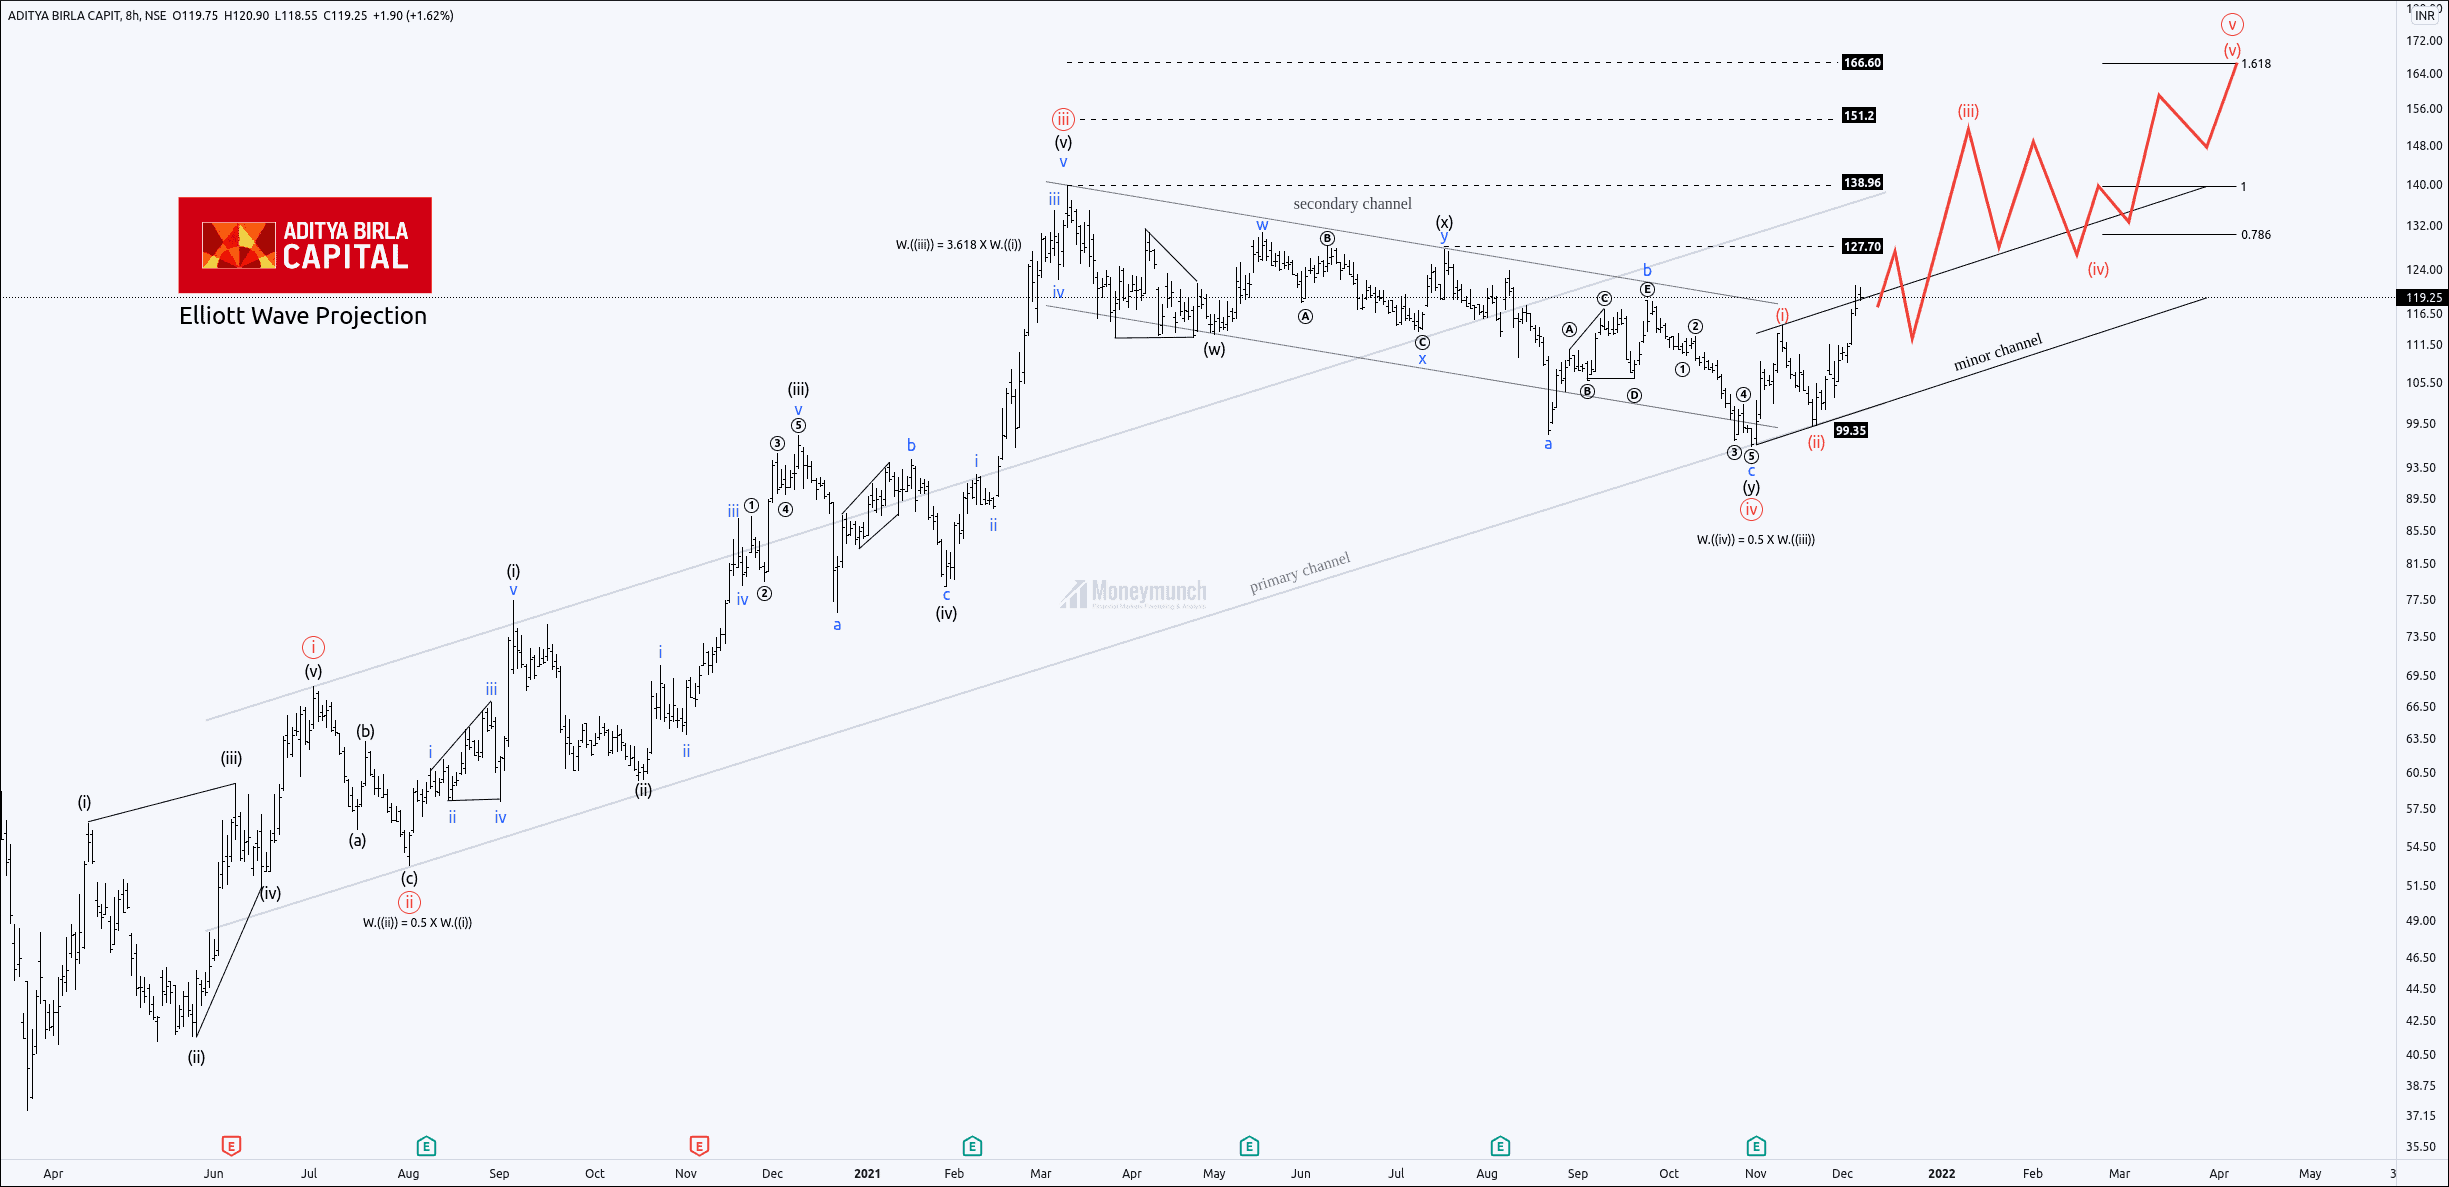
AB capital had completed the double correction w-x-y of wave ((iv)).
Wave ((iv)) retraced 50% of wave ((iii)), which signals that wave ((iv) can be ended anytime.
Successive highs and lows indicate the starting of an uptrend.
In my previous article, I had written in bold words,” We can see the following targets: 127.70 – 138.96 – 151.2 – 165.9+“.
Click here to read previous research report.
After:
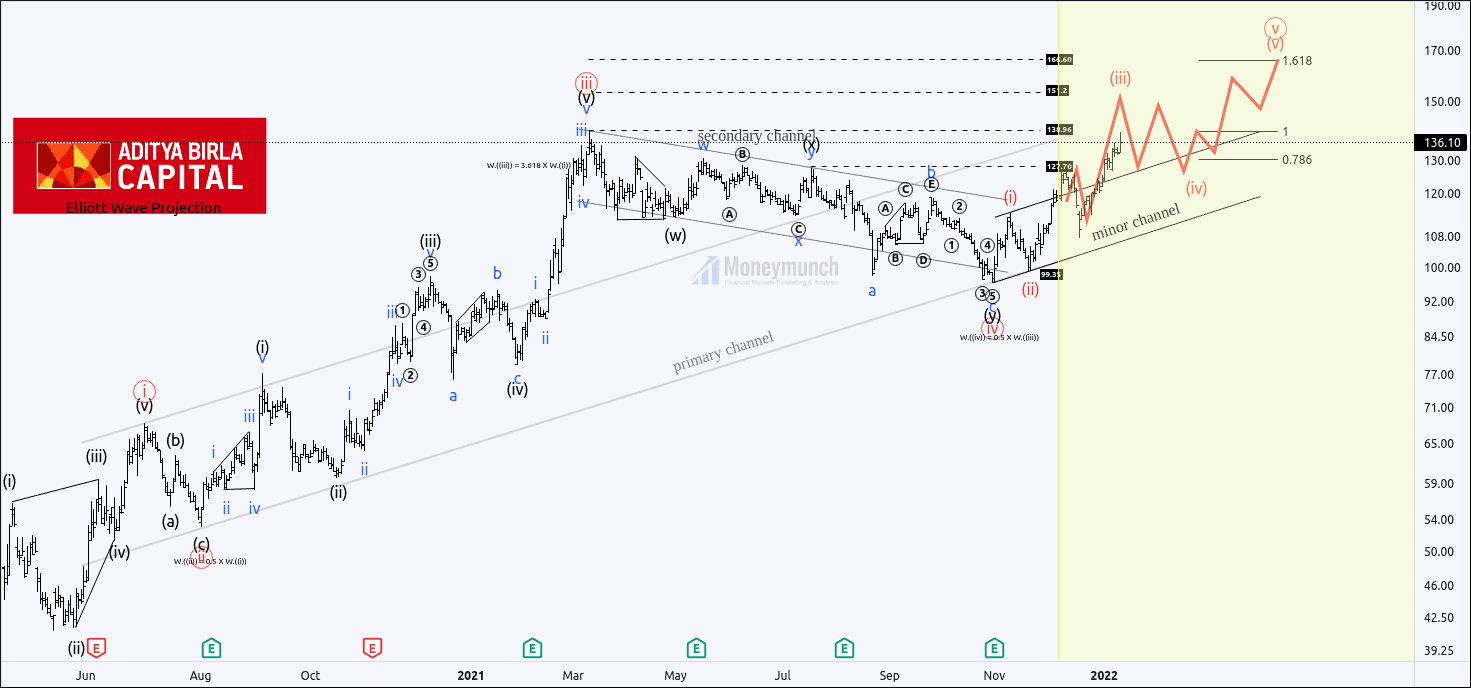
1:20 PM, 3 January 2022, price broke the high of wave (i) and moved out of the minor parallel channel.
AB capital reached the first target of 127.70 and made a high of 132.55. If the price gives a strong close above wave X, it’s a good signal for bulls.
12:35 PM, 11 January 2022, AB capital reached the second target of 138.96, and made a high of 139.20.
To become a subscriber, subscribe to our free newsletter services. Our service is free for all.
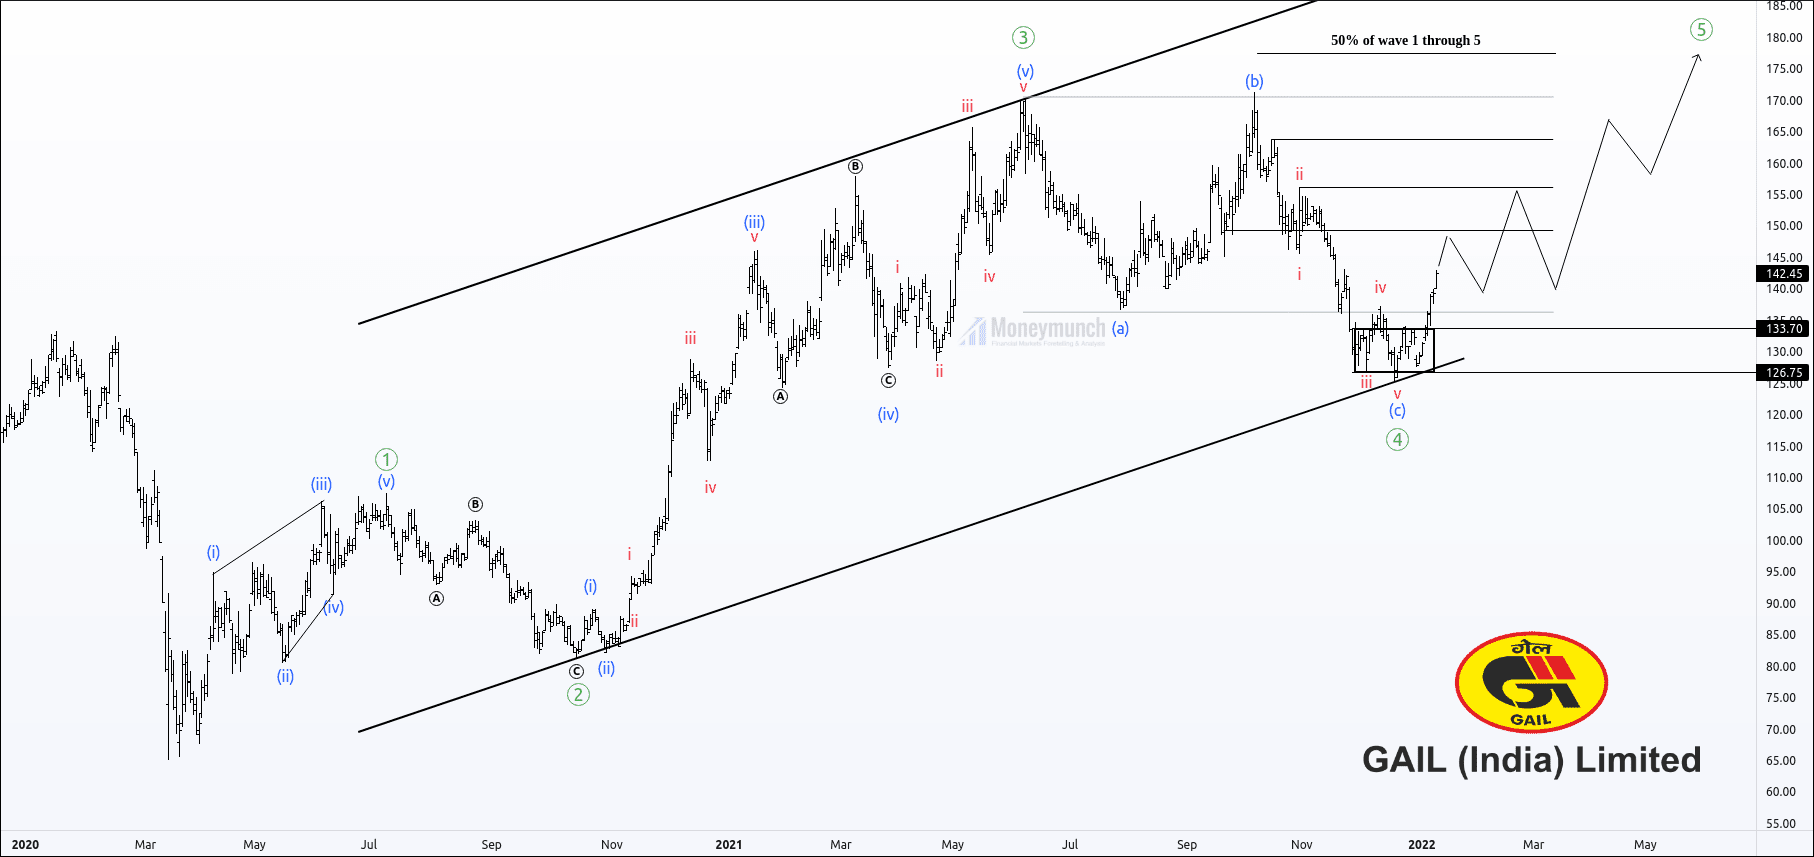
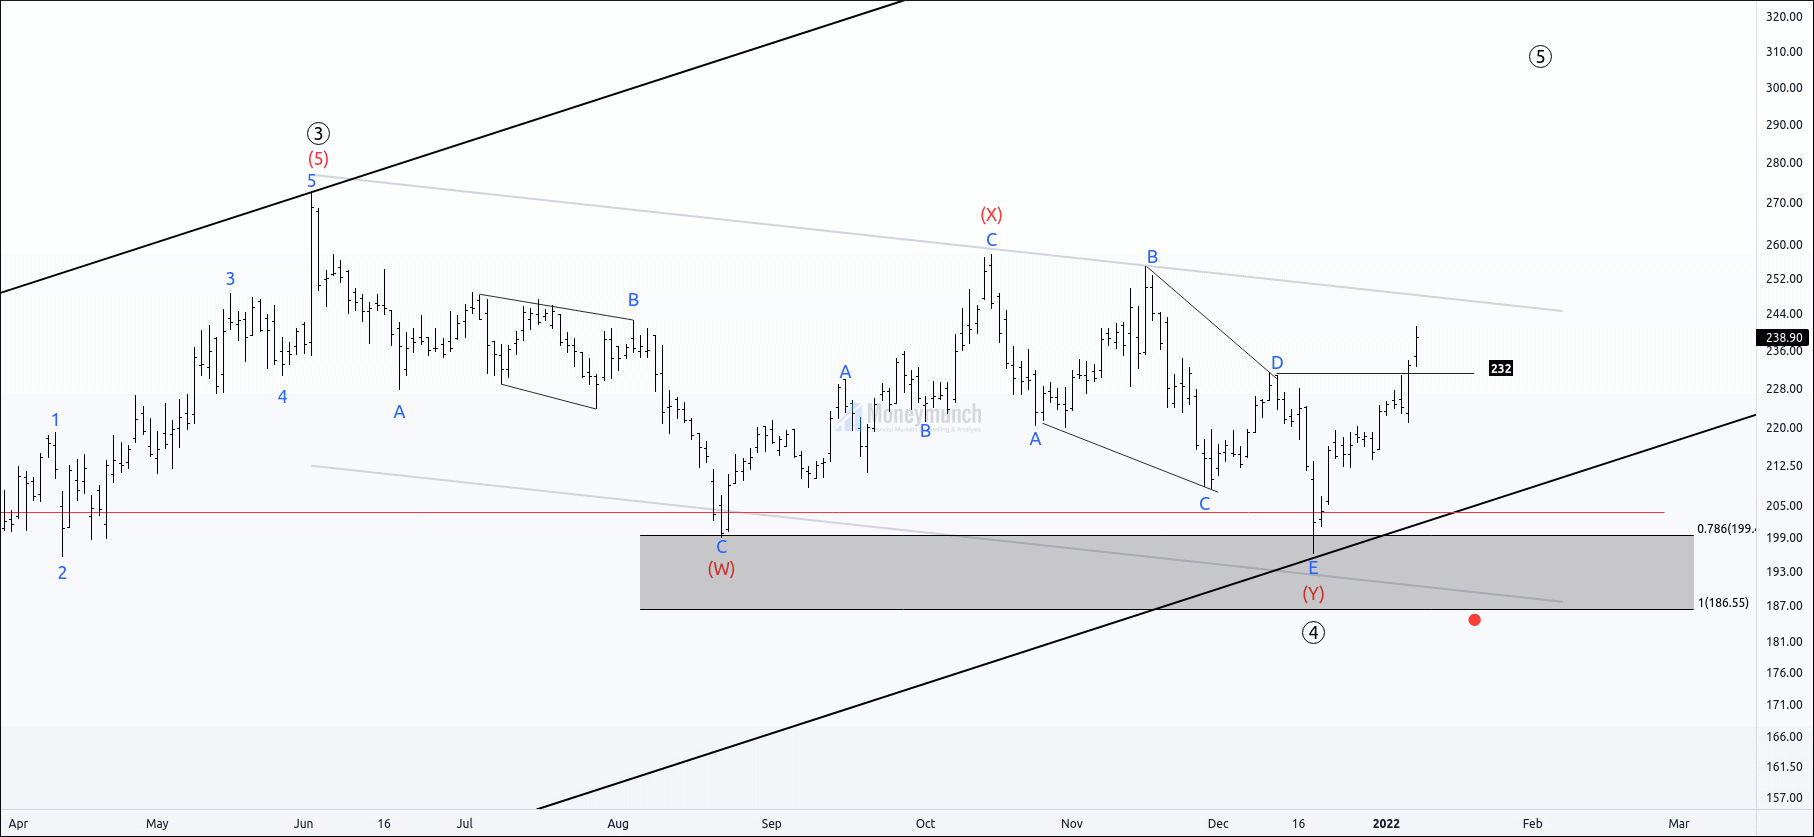
Gail India has completed its 4th corrective wave, where wave C is the last leg of correction.
Price took 27 weeks to complete the corrective wave ((4)).
After completing the wave ((4)), the price has broken the sub-wave iv and signaled a rally. It also has entered into the corrective channel, and this rally can make a new higher high.
The traders can expect the following targets 149-156-170+ for impulsive wave ((5)).
To become a subscriber, subscribe to our free newsletter services. Our service is free for all.
Wave Formations:
Wave ((1)) started to form an extreme low at 65.
– Leading diagonal
Wave ((2)) has retraced 0.618% of wave ((1)).
– Zigzag correction
Wave ((3)) has extended 2.618% of wave ((1)).
– Five wave impulse
Wave ((4)) has retraced 0.5% of wave ((3))
– Extended wave 5
To become a subscriber, subscribe to our free newsletter services. Our service is free for all.
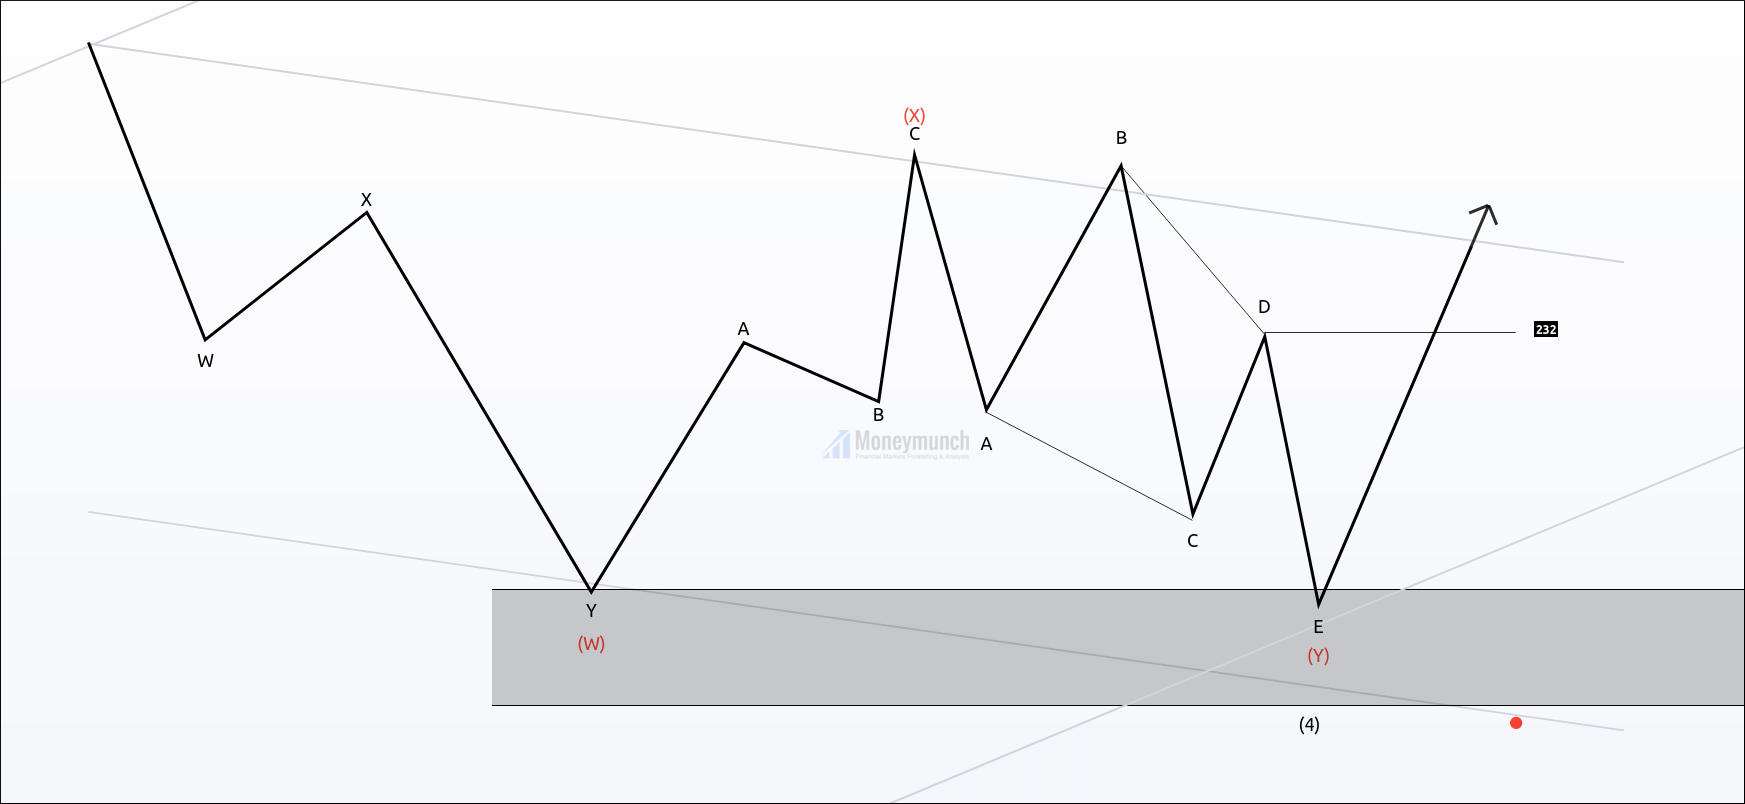
It looks like mother Sumi has completed the 4th wave correction, and the ending point of the corrective wave (4) is the starting point of wave (5).
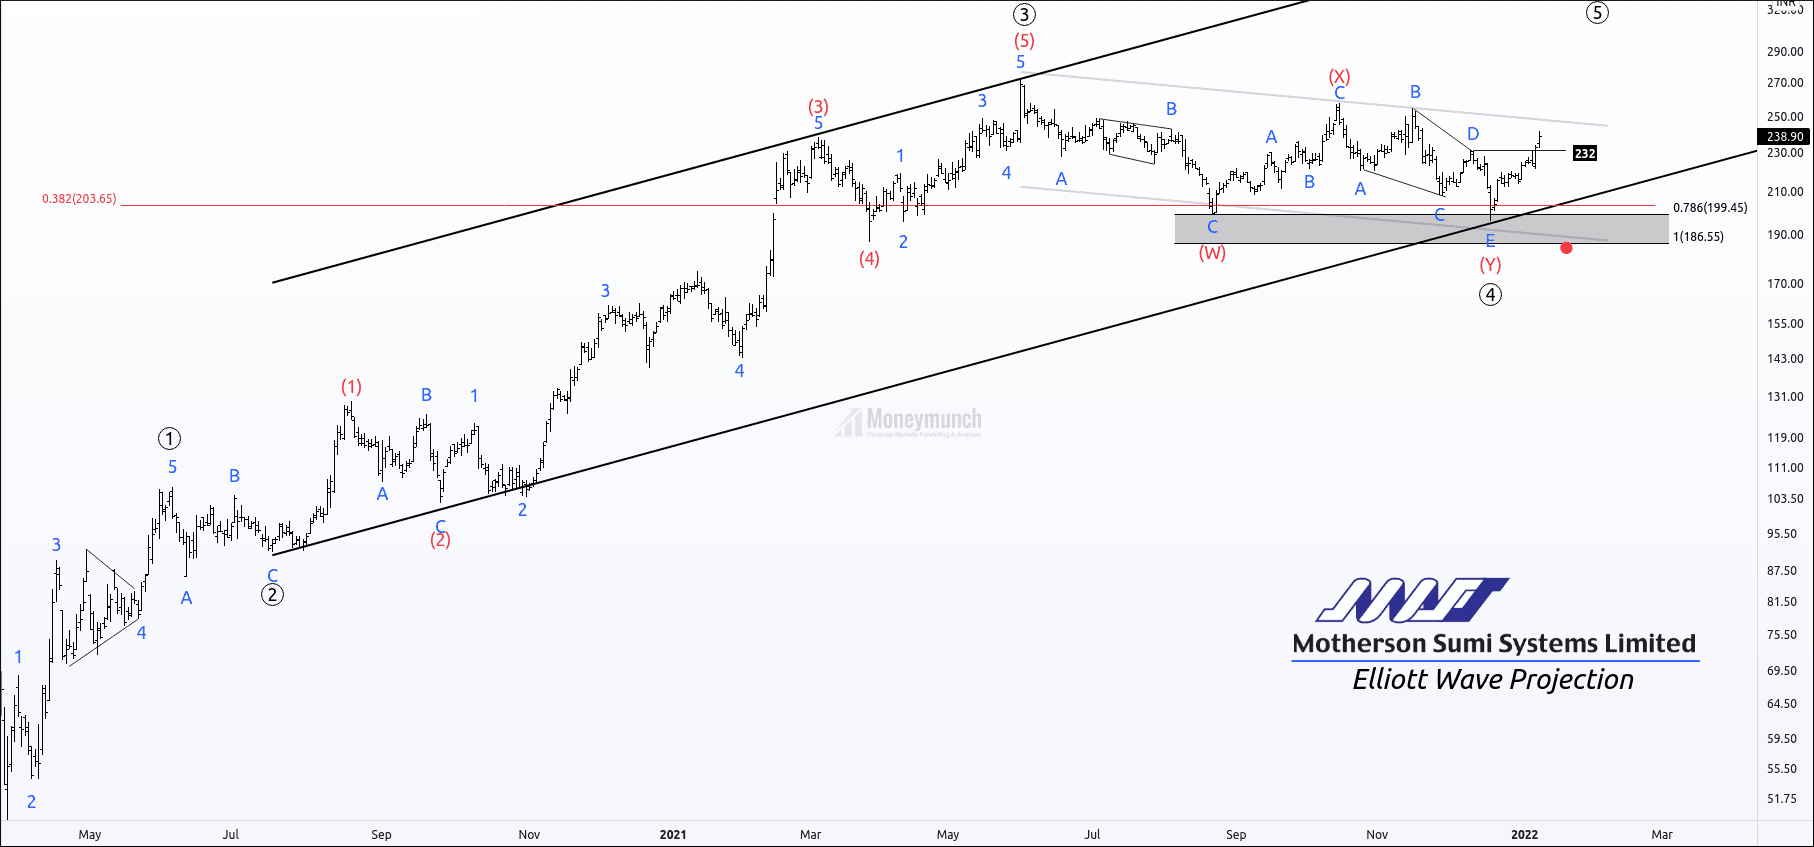
Wave formations:
Waves W is a zigzag correction pattern.
Wave Y triangle.
Wave X could form any correction pattern.
Wave X is smaller than wave W & Y.
Rules and objectives:
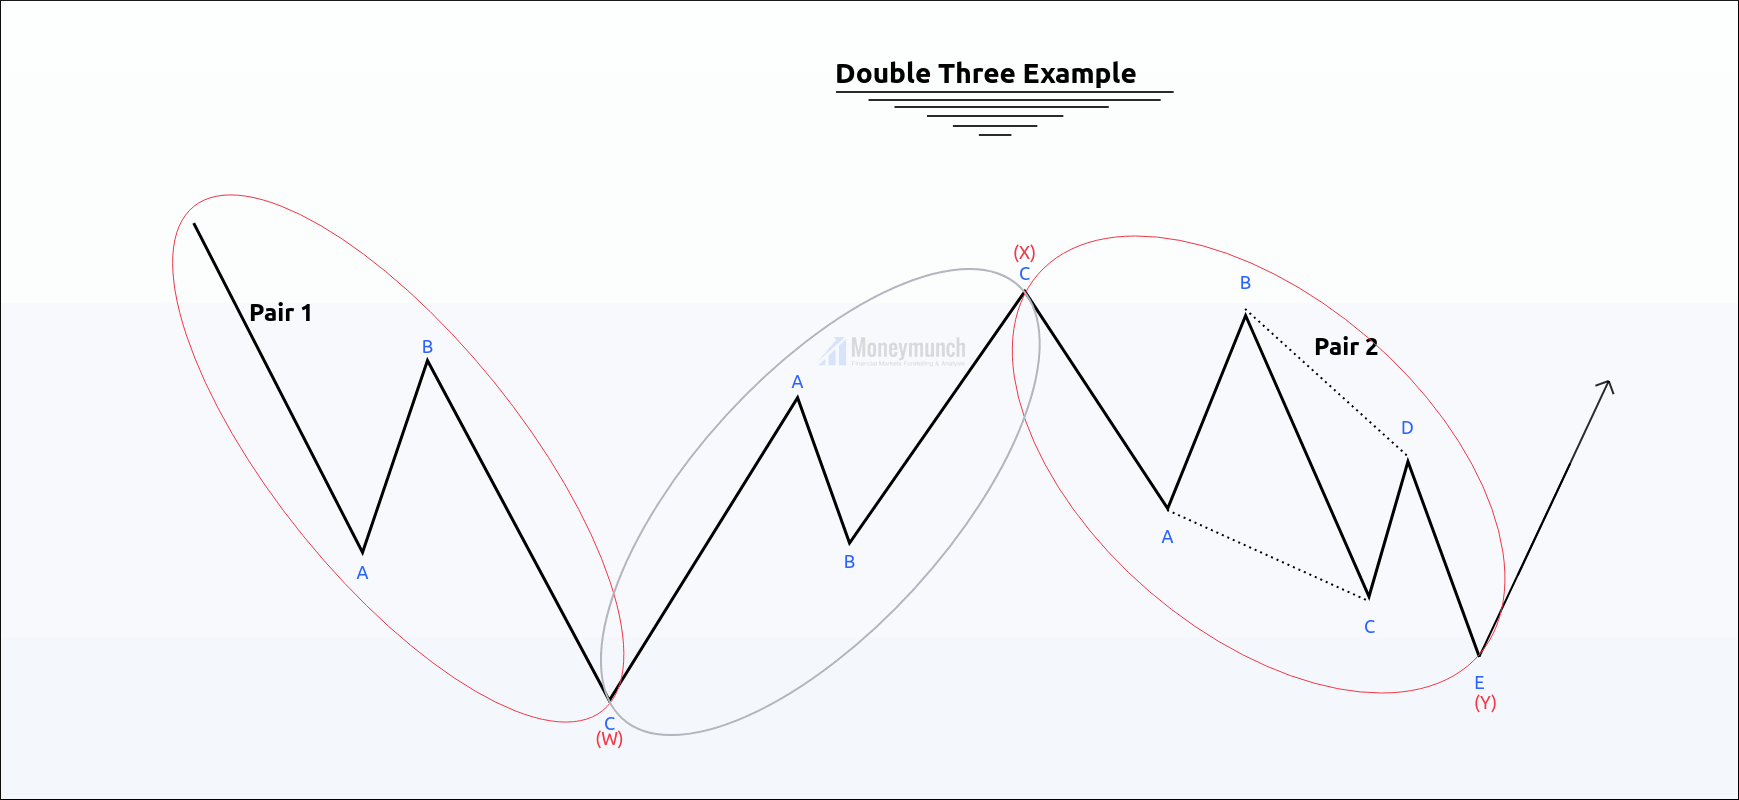
1. Double three is a corrective structure that includes more than one type of corrective pattern.
2. It consists of three waves, which are marked W-X-Y.
3. A triangle may occur only as wave Y in a double three.
4. In most cases, double threes are not deep corrections.
5. wave Y usually ends at 100% – 161.8% Fibonacci extension relative to wave W.
6. Wave Y should not go below the 161.8% Extension of Wave W. It shows that the corrective trend is strong.
What are the double threes?
Price picks up momentum when it starts an impulsive wave.
After accomplishing the impulsive wave, it corrects the previous move by a three-wave pattern.
These three waves were not enough to complete correction because of the high momentum & directional power of an impulsive wave.
Price creates another three-wave move to complete the correction by merging through intermediate wave X.[b][/b]
Let me make it easy by explaining and structuring examples.
Double three Structure:
How to labialize it?
Real Example:
Only subscribers can read the full article. Please login to read the entire article.
To become a subscriber, subscribe to our free newsletter services. Our service is free for all.
Before:

Alembic was forming in the downtrend channel. The price had completed a double zigzag of primary wave ((4)).
According to the Elliott wave principle, the ending point of the corrective structure is the starting point of the impulse.
I mentioned, “if the alembic breaks up the ending diagonal, it is supposed to reach the targets of 114-123-139 and more.
Click here to read previous research report.
However, the price must confirm the trend by breaking the wave (X).”
After:
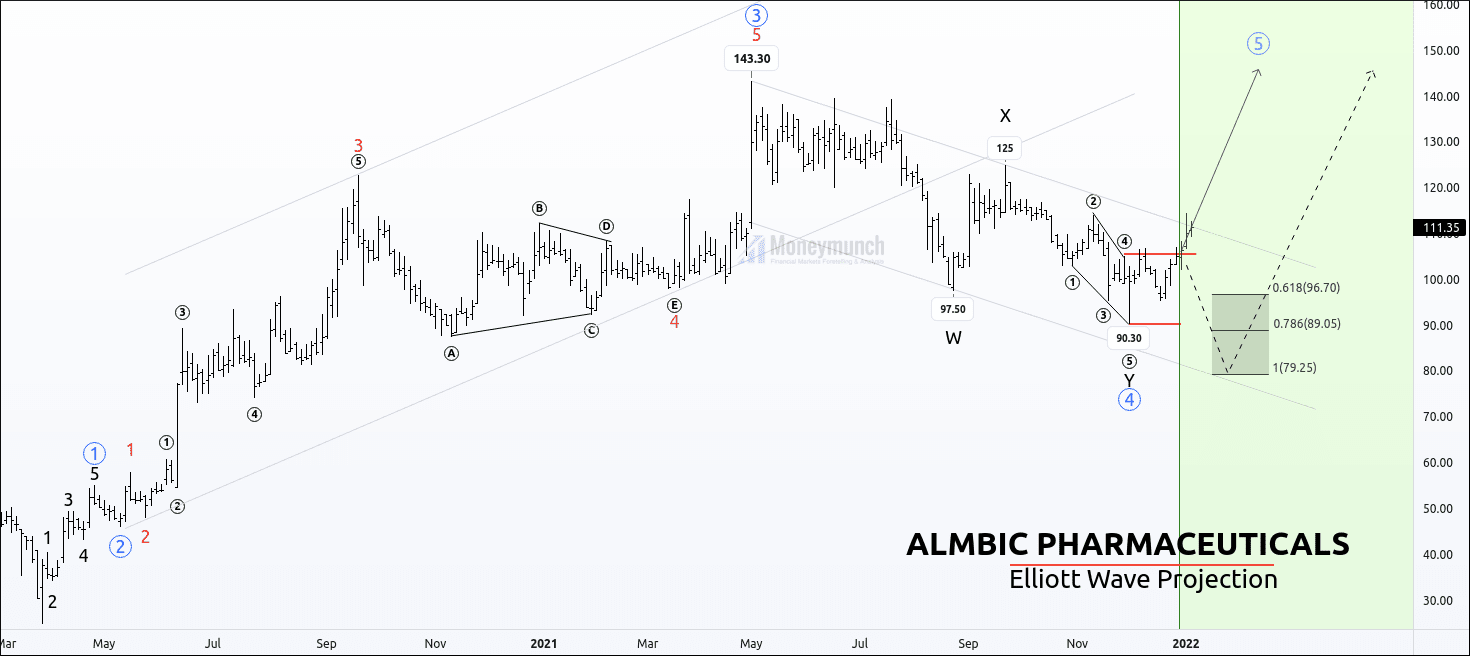
Alembic has broken the 4th wave of the ending diagonal, and price got momentum as the 5th wave is the termination wave of the ending diagonal.
12:20 PM,4 January 2022– Alembic pharma reached the first target of 114.
Alembic pharma will retrace on the support trend line, and it will start marching for the 2nd target targets.
Before:
AB capital was undergoing the complex correction of the corrective wave ((iv)). Complex correction W-X-Y accomplished at 96.35 and made a higher low.
Successive highs and lows indicate the starting of an uptrend.
In my previous article, I had written in bold words,” We can see the following targets:
127.70
138.96
151.2
165.9+
Invalidation: breakout of the minor channel”.
Click here to read the previous article.
After:
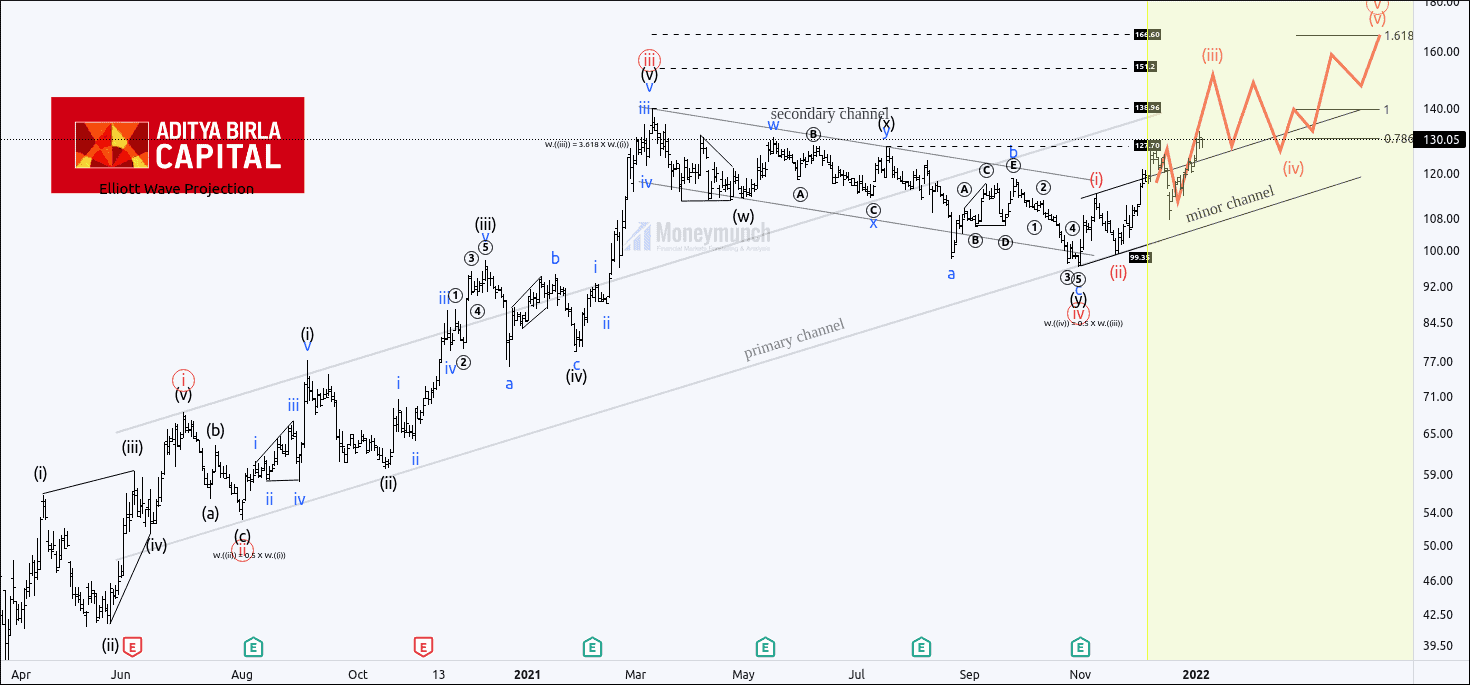
1:20 PM, 3 January 2022, price broke the high of wave (i) and moved out of the minor parallel channel.
AB capital reached the first target of 127.70 and made a high of 132.55.
If the price gives a strong close above wave X, it’s a good signal for bulls.
To become a subscriber, subscribe to our free newsletter services. Our service is free for all.