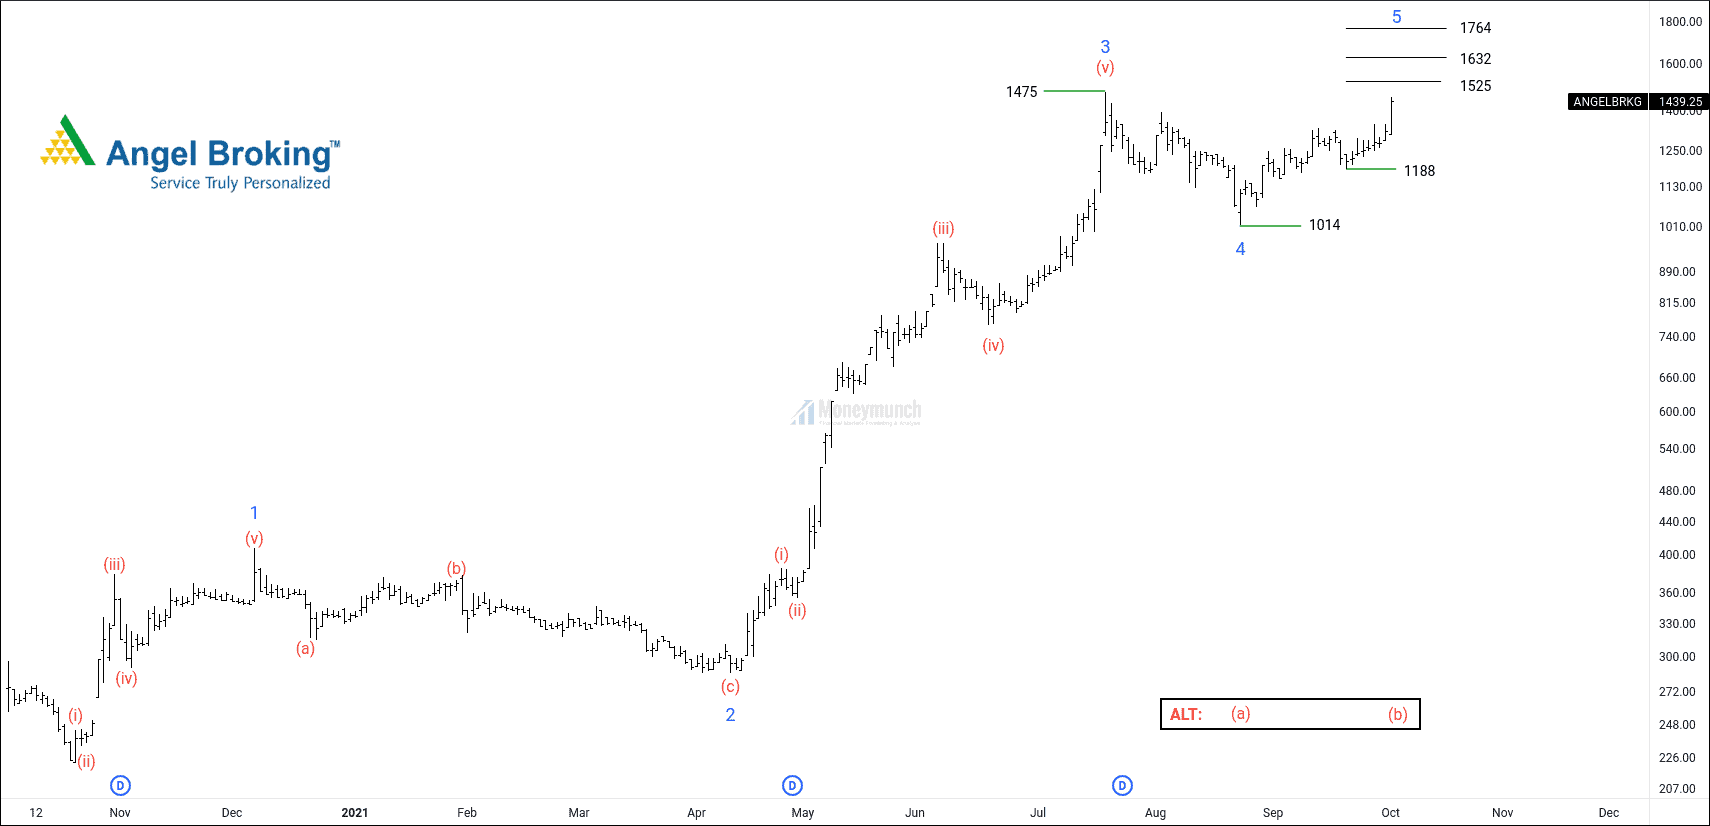
Tata Motors & Kotak Bank Trading Tips & Updates

free nse tata motors chart tips

Could Tata Motors be the hottest investment for 2021?

Price is moving under the consolidation area for 225 days. It has finalized sub-wave (C) of wave ((4)). If price breaks sub-wave 4 of wave (C) of wave ((4)), it is the beginning signal of Wave ((5)).

We can get the following swing trade targets: 340 – 362 – 415

Kotak Mahindra Bank: Profit Booking Time

free nse kotakbank chart & tips

How many of you bought Kotak Bank after this article?
Update: Kotak Bank Has An Explosive Rally Ahead

I had written in clear words, “…intraday & short-term investors can also jump on this stock. Kotak bank prices may move forward up to 1900 – 1960 – 2056 levels to hit the halfway of wave 5th. Consecutive closing above the level of 1832 is a direct buy signal”.

Target 01: 1900Achieved
Target 02: 1960Achieved
Target 03: 2056Will it touch the third target?

To become a subscriber, subscribe to our free newsletter services. Our service is free for all.

Continue reading

NSE Free Calls on Kotak Bank, YES Bank, and Eicher Motors

free nse yes bank daily chart & tips

YES Bank: Price action analysis & trading tips

The YES Bank stock has started falling for a long period. If it breaks the consolidation area, it will keep collapsing, and we may see 10 – 9.60 levels soon. It’s under that range from the last 17 days.

But according to price action analysis, it will try to jump up to make a new LH. It can be nearby the 12.15 – 13.5 range. Safe investors can start selling nearby dynamic LH with the stop loss above the hurdle line.

free nse kotakbank chart & tips

Kotak Bank Has An Explosive Rally Ahead

NSE Kotak Mahindra Bank has started marching upside because it has completed wave ((4)). Its fifth wave will end nearby the retracement of wave ((4)) of 161.8% and sub-wave of (4) of 161.8%. So, long-term investors may hold for the targets of 2345 – 2446 – 2536.

At present, intraday & short-term investors can also jump on this stock. Kotak bank prices may move forward up to 1900 – 1960 – 2056 levels to hit the halfway of wave 5th. Consecutive closing above the level of 1832 is a direct buy signal.

A short reversal is expected at the last target of 2056.

nse eicher motors stock tips & chart Continue reading

EWT: Will Nifty Hit 18000 Before September End?

free nifty stock tips daily chart

Extending wave (5) should easily travel above 18000 and is likely to continue toward 18480.

Target 1: 18000
Target 2: 18142
Target 3: 18350
Target 4: 18480

To become a subscriber, subscribe to our free newsletter services. Our service is free for all.

Continue reading

RELIANCE: EW target and Reversal point for ABC correction

We’ve traded today

This CALL was given to our SUBSCRIBERS:

NIFTY Sell below 14719 for targets 14576 and stop-loss 14745
This trade was achieved by us.

Traded Level 14719, Target 14576, equals to 143 points profit and stop-loss only 26 point. The PROFIT is 10,725 just only in 1 lot sizeTo become a subscriber, subscribe to our free newsletter services. Our service is free for all.

RELIANCE:

This stock price moving to 2193 and 2235 as target. As per the Daily chart the correction can be 2250-2230.

EW on Daily chart

EW on Weekly chart.

Continue reading

Parallel Channel and use of it over the NIFTY

We found that a price is frequent spending more and more time between “Upper-Band” & “Gravitation line”. In other words, a price staying much of time between “Upper-Band” & “Gravitation line”.
Look at the upper-bank has 6 touches.
We are seeing no activities between the lower band and control price. That’s why we concluded that if price breakdown, gravitation line will be confirmation of fall. Yes, you can take profit from this type of trend by using buy at control price and sell at the upper band.

To become a subscriber, subscribe to our free newsletter services. Our service is free for all.

Continue reading

Short term view in NIFTY50 for INTRADAY

Intraday support 14112, Resistance 14219
INTRADAY traders can short their position for the target of 14118 nearby.

If there will be breakout and price will cross the main resistance level that is 14219 then nifty will be still much bullish as indicators are indicating.

TECHNICAL INDICATORS

Moving Averages – Bullish

Technical Indicator – Bullish

Moving Averages Crossovers – Bullish

To become a subscriber, subscribe to our free newsletter services. Our service is free for all.

Continue reading