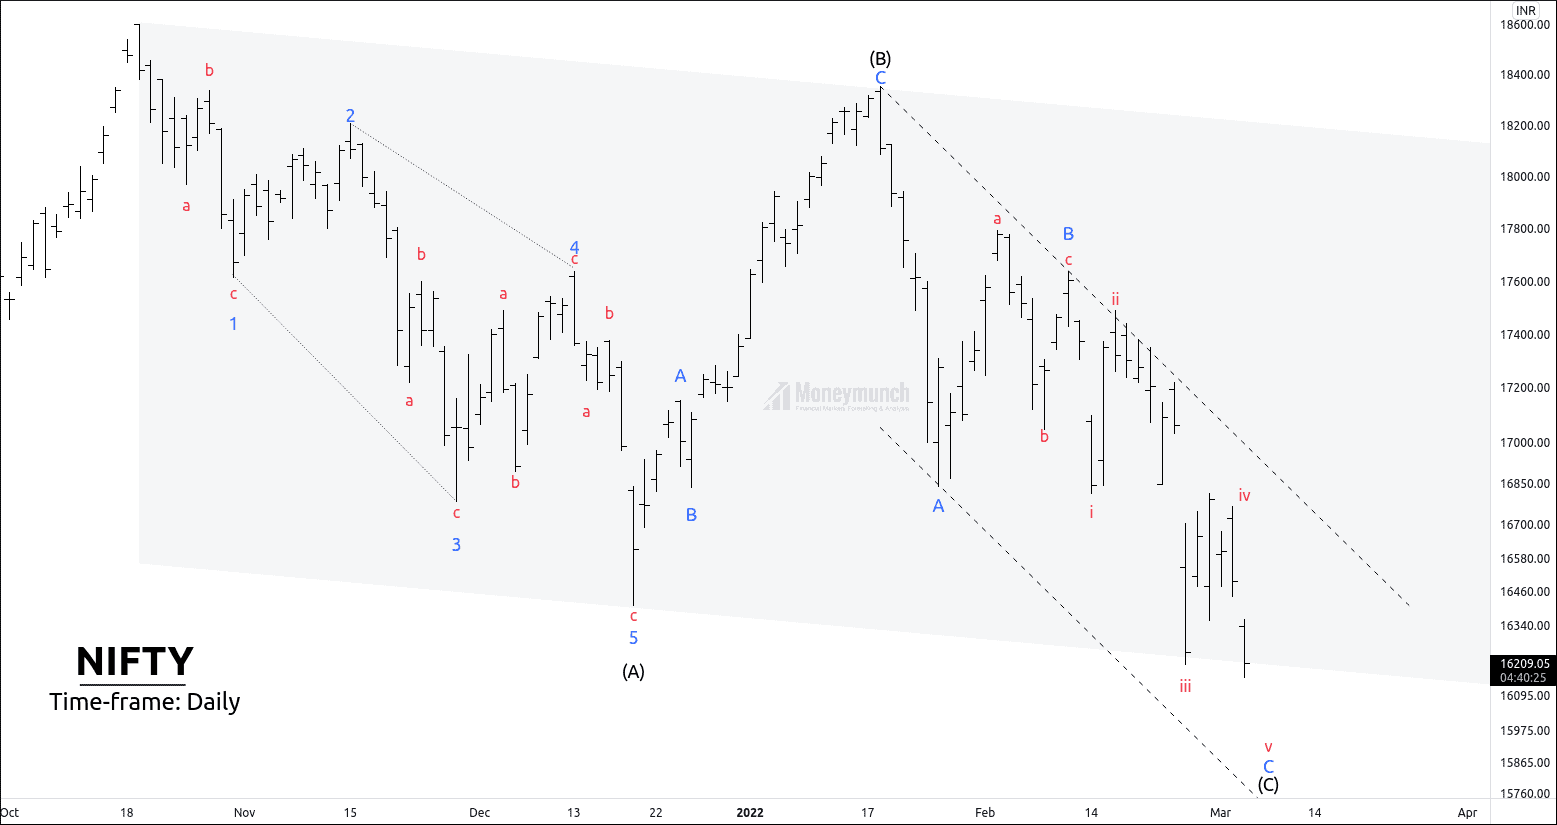
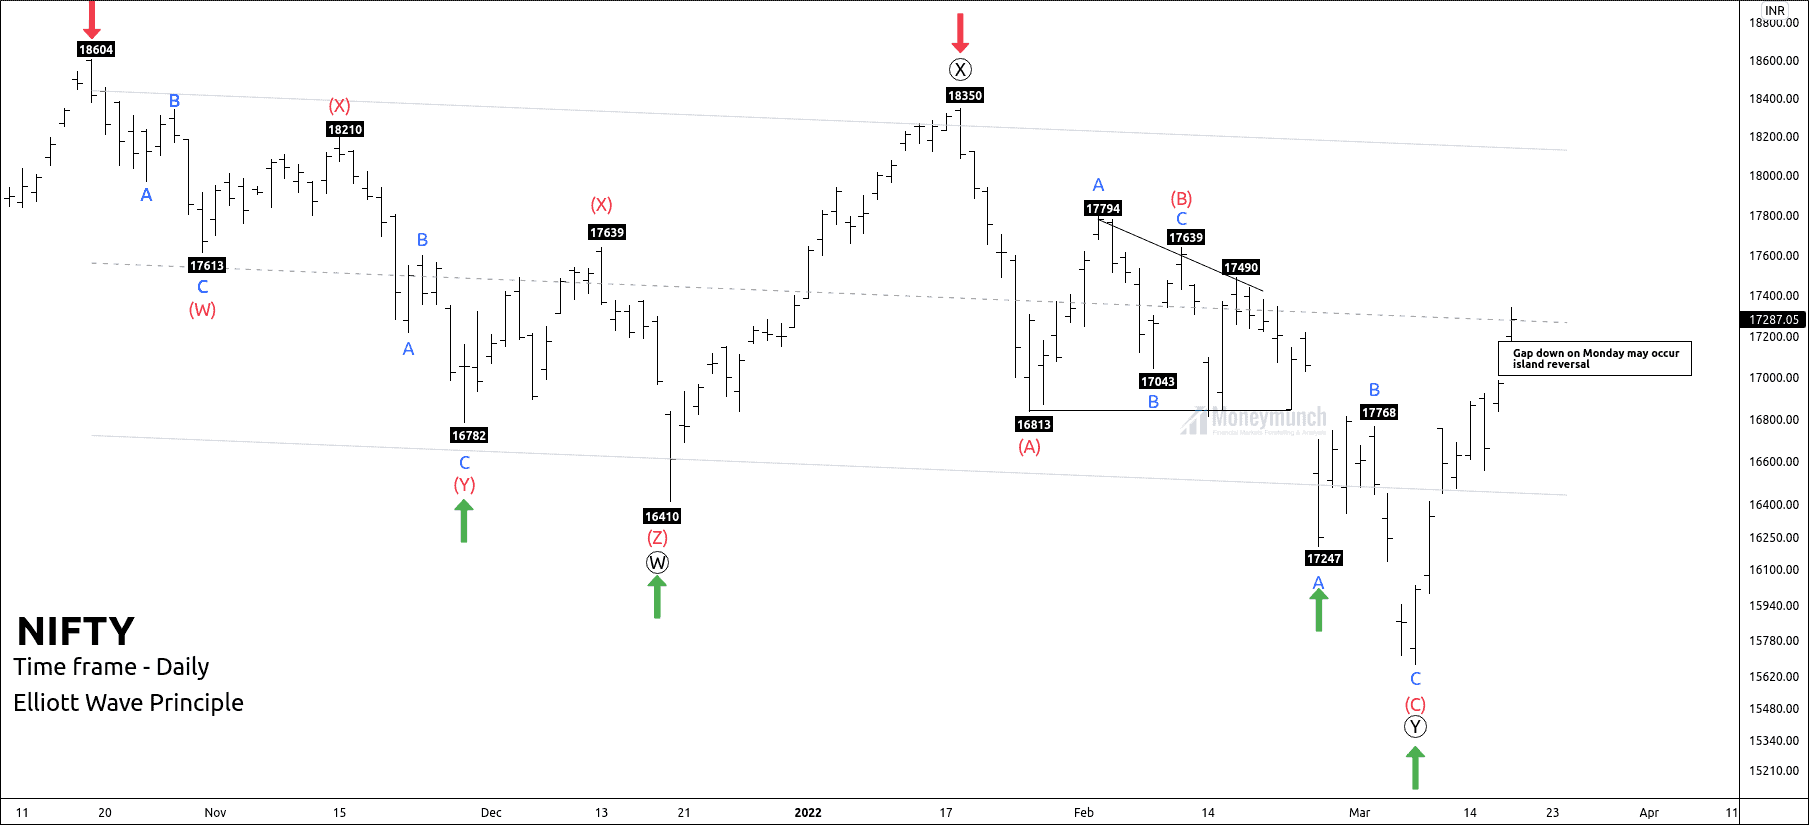
To become a subscriber, subscribe to our free newsletter services. Our service is free for all.
NSE Devyani Int – Buy This Stock NOW?
Read this full report carefully to get an accurate entry level for buyers. Devyani International has created an all-time high of 198.90. Price faced supply pressure that bulls couldn’t hold their power, and it has started correcting for upcoming impulsive structure. After counting the wave, we can name this correction 4th corrective wave, and the all-time high was impulsive wave 3.
Short-term traders can trade for the following targets: 172-180
Positional targets for 5th wave: 187 – 200 – 230+
To become a subscriber, subscribe to our free newsletter services. Our service is free for all.
We know one basic rule of wave principle, “the ending point of the corrective wave is the starting point of the impulsive wave.”
What pieces of evidence do we have for the ending point of a corrective wave?
+ Price retraced back from 61.8% at 142.50 (from the low of 107.55 to the high of 198.99)
+ Wave 4 can occur at the 4th wave of a lower degree.
The 4th wave has retraced back from the price territory of wave (4).
If Devyani breaks the low of wave (C), it may complete the final move near the price territory of wave (4).
+ Price has already retraced 61.8% of wave 3. Wave C has created a throw-out which suggests the accomplishment of wave (C). But I am not a big fan of deciding without confirmation. Let the market commit first before you commit to the market.
+ Wave (A) = Wave (C). Wave C has retraced 100% of wave A.
The trader can wait for a pullback to generate a new entry.
If Devyani international breaks wave (C), traders can wait for the gray zone.
Price has to break wave (B) to confirm its bull trend.
Further information will update soon.
NSE DrReddys Fut & Ujjivan Fin & RBL – Bearish Trend Continues?
DrReddys Fut could crash more
Dr. Reddys Labs Fut closed at a crucial level. It has to take a U-Turn from the current closing price. Otherwise, speculators will keep selling. And according to TA, we will see the target of 3780 – 3720 levels soon.
NSE RBL extending downtrend’s extent?
RBL (Rane Brake Lining) has started a downside rally since mid-2021. Its annual income drastically dropped. That’s all for long-term investors. If you are a day trader or short-term investor, you must sell it.
Key level: 628
If it breaks the above level, then the stock price will hit the target level of 610 – 600 – 570.
NSE Ujjivan Fin Serv Downtrend Intact
In bull or bear battle, the bear is winning here. Intraday traders must watch this stock. It’s a printing money machine.
Crucial level: 105
Expected Targets can be: 100 – 98 – 94
To become a subscriber, subscribe to our free newsletter services. Our service is free for all.
NSE ASTRAL – Earn From Market Recovery
The stock market has started recovering. Still, there’s a big question, is Russia and Ukraine war over yet? Start investing during stock market uncertainty using Elliott Wave Projection.
It looks like ASTRAL has accomplished the corrective structure and started forming motive waves.
Price has ceased the sub-wave 5 of motive wave ((c)), and the length of wave (A) is equal to wave (C). So, this is called wave equality, where wave (A) = wave (C).
If the price has bullish sentiments, the ASTRAL will not directly jump to complete the impulsive wave 3, but it will create sub-waves of motive wave 3.
If traders are willing to initiate a long with low-risk setup, they can wait for a pullback of the previous move to reduce the length of stop-loss.
Please note that wave two can never overlap the starting point of wave one.
If the current move exceeds the low of 1769, we can’t consider this an impulsive wave.
Wave three can travel for 161.8% Fibonacci extension of wave one at 2047, and power extension can derive price to 2217.
Traders can expect the following targets for the 3rd wave: 1976 – 2025 – 2144 – 2216.To become a subscriber, subscribe to our free newsletter services. Our service is free for all.
NIFTY FUT Trade Setup For Members
To become a subscriber, subscribe to our free newsletter services. Our service is free for all.
Will NIFTY Skyrocket or Collapse?
In this outlook, we are covering two scenarios that will be helpful for day traders as well as investors. We should negate the possibilities because Murphy’s law says,
Whatever can happen will happen
Shall we direct jump on the pool? Yes, shallow ends first.
After creating a high of 18600, the price has occurred a double zigzag. Currently, we are riding on the impulsive wave sub-wave 4 of wave C of complex (Y).
Wave Structure:
Wave ((W)) – 16410
+ Internal structure – Triple Zigzag
+ Fibonacci relationship – 50% of wave ((5))
Wave ((X)) – 18350
+ Internal structure – Engaged corrective wave
+ Fibonacci relationship – 100% of wave ((W))
Wave ((Y)) – New low at 16203
+ Internal structure – Zigzag correction
+ Fibonacci relationship – 100% of wave ((w)) at 16156.
Target projection for scenario 1:
- Wave (C) can end near the 1.618% Fibonacci extension of the wave (A) at 15363.
- Wave ((Y)) can cease at 100% Fibonacci extension of wave ((W)) at 16136, but if the price breaks this level, then the next Fibonacci level is 15600.
To become a subscriber, subscribe to our free newsletter services. Our service is free for all.
Perspective:
Price has completed the double zigzag correction by completing wave C of wave (Y).
Wave ((Y)) has already traveled 100% of wave ((W)). Price will start an impulsive cycle, which will be the sub-wave of wave ((5)).
Price has to confirm its bullish move by breaking wave B at 17794.
Bullish sentiments can derive a price for 19000 and more.
Unlock This Article


