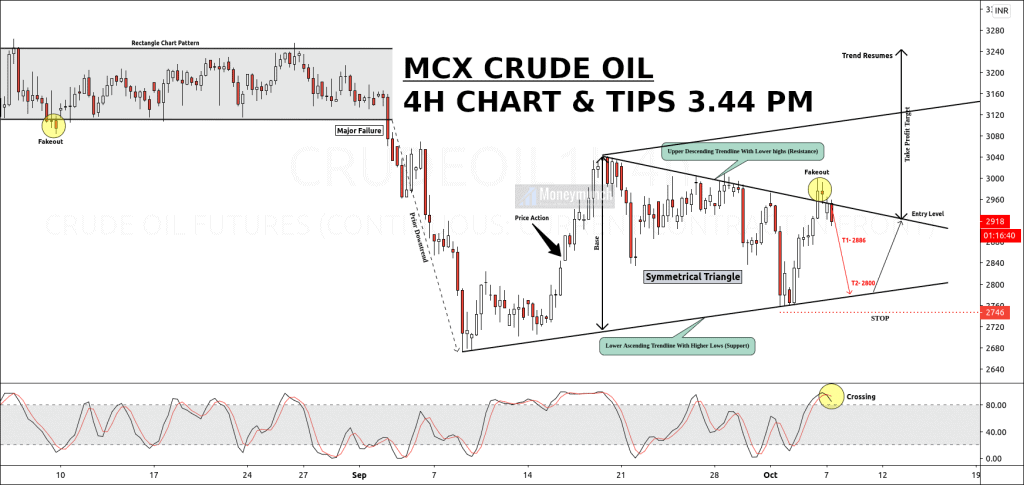
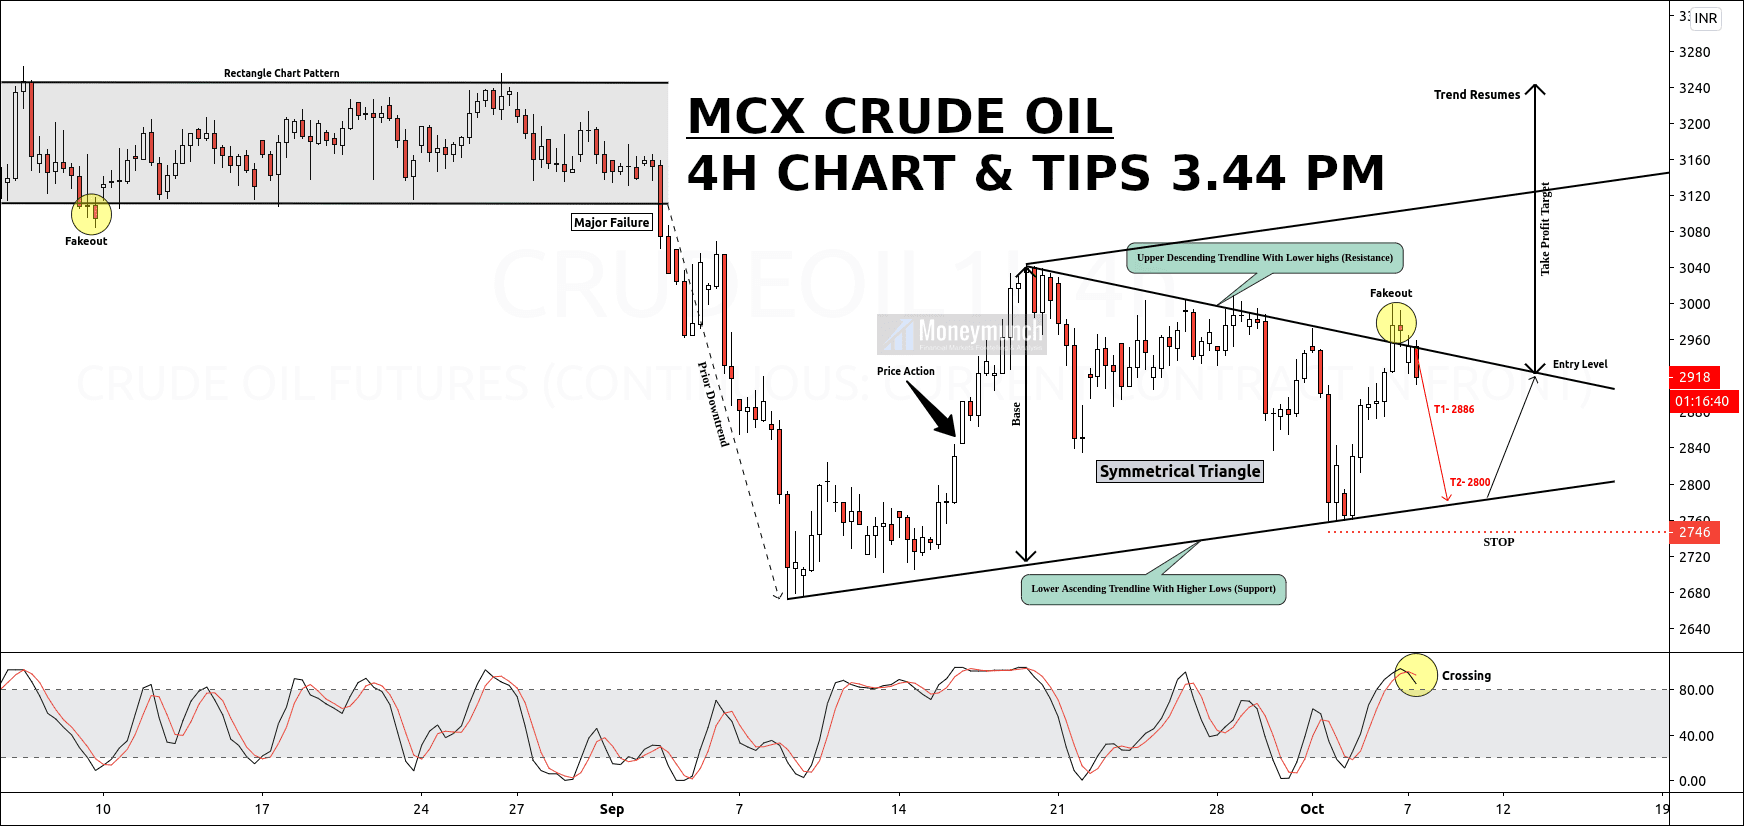
The trend is making a symmetrical triangle.
In the symmetrical triangle, you can see the trend is descending, and it will continue to fall up to the particular targets, which are shown in the charts (T1 2886 & T2 2800).
After knocking the lower ascending trendline with higher lows (support), It will bounce to the upper descending trendline with the lower highs (resistance). After that, If the trend makes consecutive candles, there will be an ascending trend. But don’t sell if the trend falls and crosses the stop loss.
To become a subscriber, subscribe to our free newsletter services. Our service is free for all.
Get free MCX ideas, chart setups, and analysis for the upcoming session: Commodity Tips →
Have you any questions/feedback about this article? Please leave your queries in the comment box for answers.


It has touched the first target.sir, what should be my next step?
sir pehla target a gaya so dusre k lie hold karu ya kat du?
If you are a free subscriber, you can book the full profit here. Thank you!