To become a subscriber, subscribe to our free newsletter services. Our service is free for all.
Continue reading
Access free trading tips and analysis on major forex pairs, cryptocurrencies, and Indian NSE currency tips. Stay informed and improve your forex trading skills with Moneymunch.

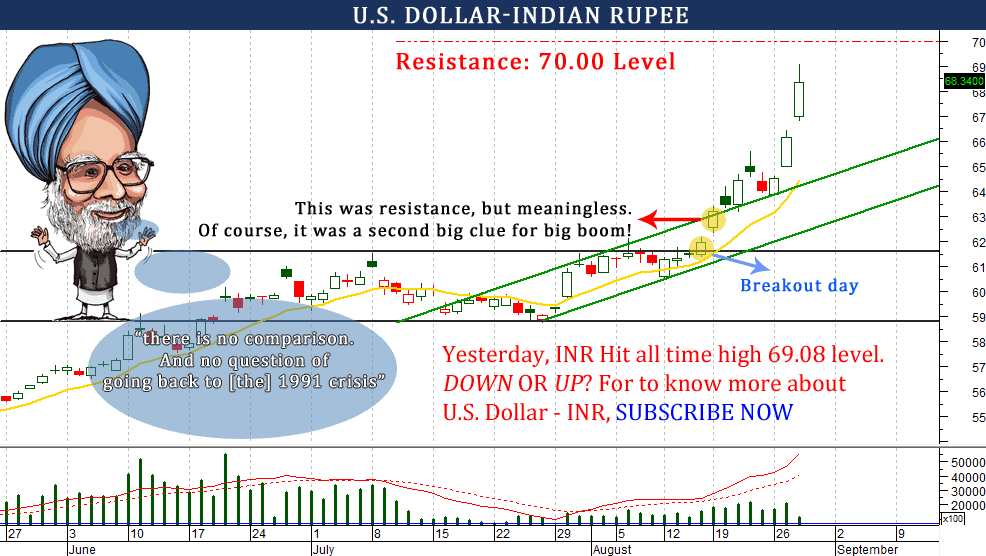
 Dollar Rupees (USD/INR) from last week to rallied almost 5% and from lows of 57.66 to high at 60.17. USDINR last closed at 59.77 with gains of 0.0625 paise. It’s overall trend still upward. Today USDINR is looking weak and it can touch 59.56-59.45 but when it breaks 59.65. If Dollar Rupees open upwardly then wait for 59.79 either buys at opening bell. It will hit 59.85-59.89-59.94 above.
The support at 1.3159 has been broken.
• EUR/USD has broken to the downside out of
its horizontal range between the support at
1.3159 and the resistance at 1.3308. Further
short-term weakness is favoured as long as the
hourly resistance at 1.3191 (intraday high) holds.
Supports are given by the rising trendline and
1.3041 (13/12/2012 low).
• The higher low in July 2012 (compared to July
2010) and the recent new high above the strong
resistance at 1.3172 suggest an improvement of
the underlying trend. A strong resistance is at
1.3487 (24/02/2012 high).
To become a subscriber, subscribe to our free newsletter services. Our service is free for all.
Japan is following in the footsteps of the man who laid the groundwork for the greatest global inflationary operation of the modern era. We see the Yen in the top panel of the chart below forming a similar pattern to that which USD made from 2000 to 2002 as an epic bubble in credit expansion was being fomented in the US.
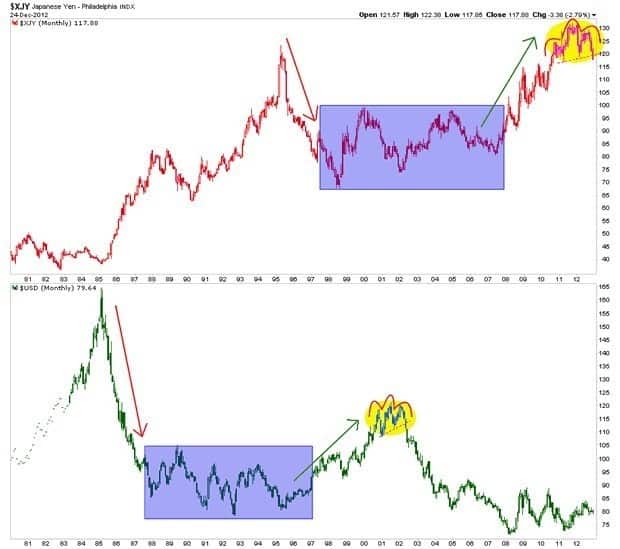
The similarity in the charts (with a decade stagger) is striking and it is probably no coincidence that Japan has chosen to leverage its currency – which had been chronically strong since the 2007 beginnings of the US-triggered global financial meltdown – just as the US did with the once strong ‘King’ dollar in and around 2001.
The pro-growth monetary policy should mildly support economies throughout the world in 2013, despite the persistence of different risk factors. The US dollar may decline further. What will happen to stocks and bonds?
The EURUSD played a starring role during the last part of 2012. This uptrend, which started in July after President Draghi declared the European Central Bank’s (ECB) willingness to buy unlimited bonds, is still ongoing. The market is meeting an important resistance at 1.33 and corrections are therefore possible. Uncertainty exists regarding Italy’s capability of forming a meaningful government after the political elections next year in February. However, the medium-term uptrend remains intact for the Euro against the US dollar. The ECB should not cut rates short-term, as the economy, though weak, is improving. The latest Purchasing Manager’s Index (PMIsurvey signaled that productivity has bottomed out and should start to rise over the medium-term. The ECB’s “wait and see” approach can support the Euro to reach higher levels. Since 1977, bull-moves within long-term bull cycles have lasted between 20% and 30%, top to bottom, before fading away. Consequently, an increase above 1.3350 can raise the price of the euro to 1.36, and eventually to 1.44.
Although Japan is in recession, Japanese housing starts, industrial production, and consumer sentiment have recently been positive. Prime Minister Abe has become more accommodative in his tone toward the economy. The Japanese yen could experience less pressure in the months ahead. Currently, USDJPY is experiencing a runaway bull-trend and is meeting good resistance at 84.55. It corresponds to two long-term trendlines and should hold at first touch. The US dollar is in fact extremely overbought and could correct to 83.00. According to the latest Commitment of Traders (COT) report, futures funds have bought massive amounts of the US dollar; a move above 85.10 will shift the price to 86.20/87.00
The debate in Congress over the “fiscal cliff” is ongoing. A compromise could be found by the first part of 2013. As risk continues to fade, the US treasury yields should move toward 2.00%. The Federal Reserve is willing to let inflation expand in order to create positive momentum in the job market. Technically, the US ten-year note prices are leaning against the upper channel line of the past 26 years. A tentative breakout occurred in July and has apparently failed. In fact, the market is extremely overbought. According to the latest COT report, future funds have accumulated about 400,000 contracts of the ten-year treasury notes, the highest level in the past four years. What is left to buy if most of the major players are already in the market? In 2013, the prices of the ten-year notes futures could decline for 3-6 months and reach 132-130.
With bond yields rising and the dollar declining, US stocks should appreciate in the first part of 2013 as well. US company earnings are still performing well, while profit margins should improve with the labor market only mildly growing. The Fed’s pro-growth approach is supporting prices, and once Operation Twist concludes, it will be followed by net bond buying. Technically, the S&P 500 index is challenging the higher Bollinger bands at 1450. A swing above 1475 could lift prices to 1500/1550. Historically, January is a good month for stocks. Volatility could increase, however, if a compromise is not found in the short-term. During the last part of 2012, US companies and households have already reduced spending. The business sector can increase production only if foreign demand rises faster in 2013 than in 2012. The latest data has shown that China’s economy is growing again, but other so called “emerging markets” are still underperforming. A recession in the US will destabilize the world’s still fragile economic recovery.