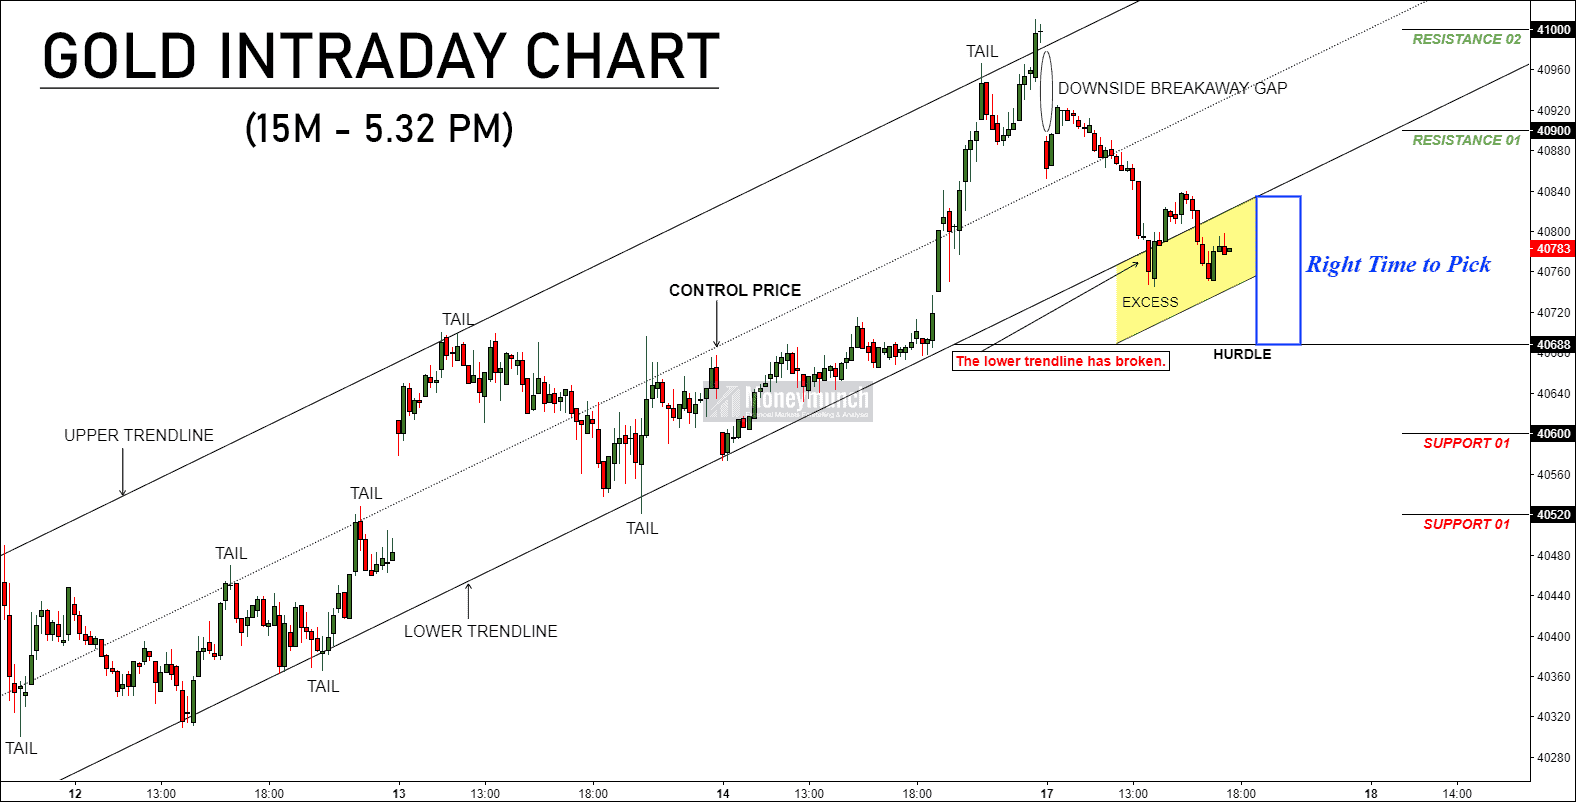
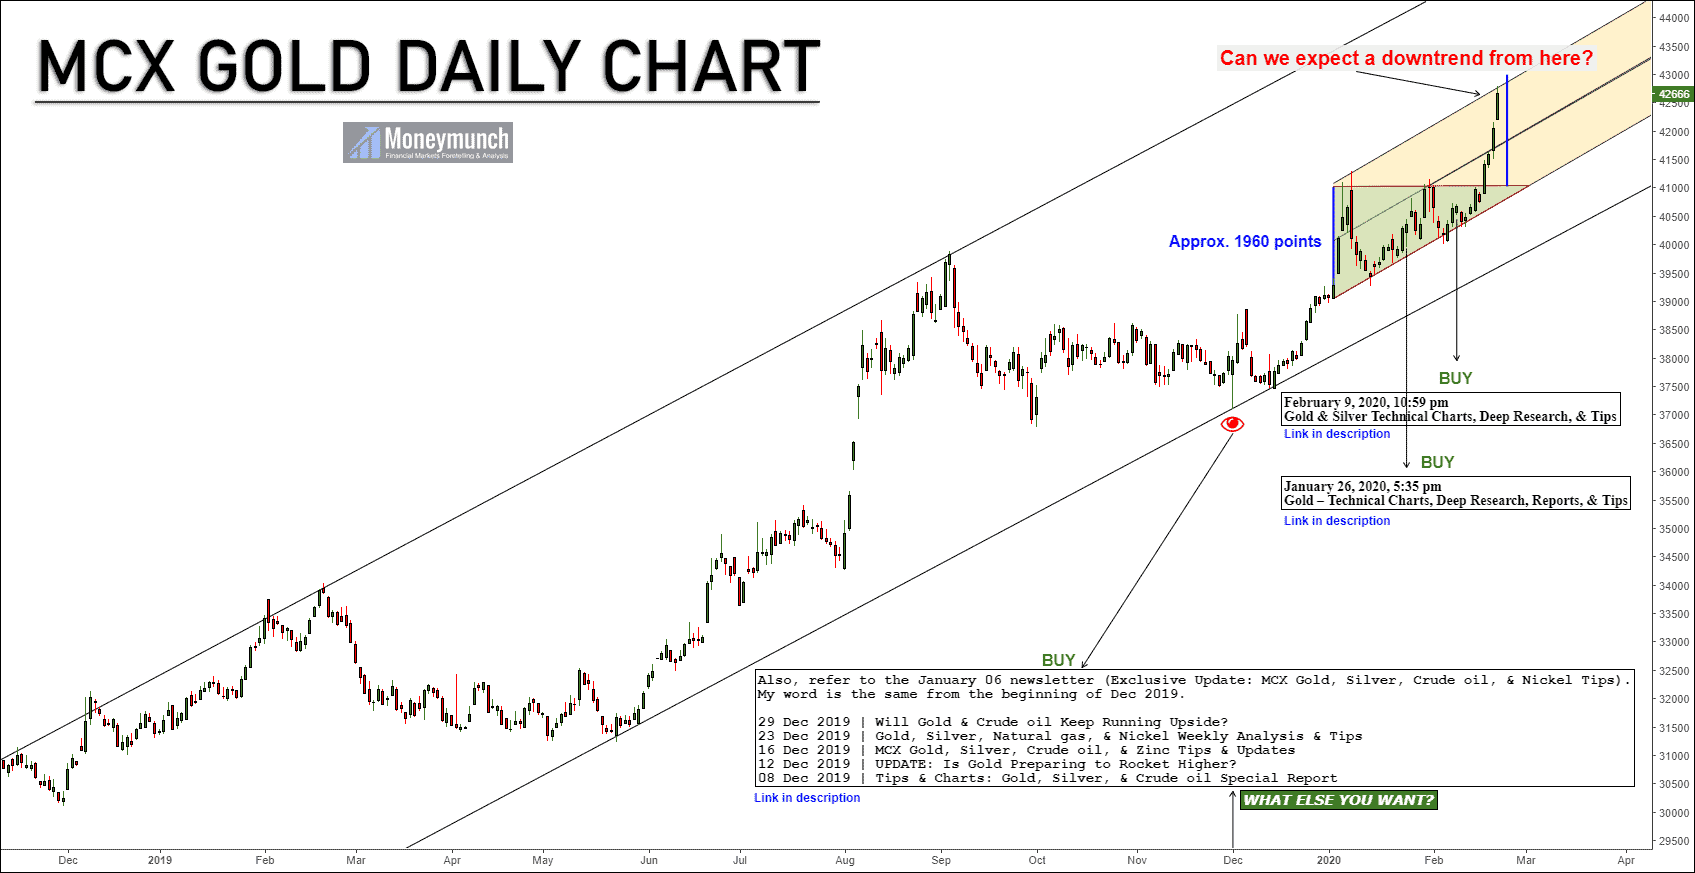
Gold Is NOT Bullish…!?
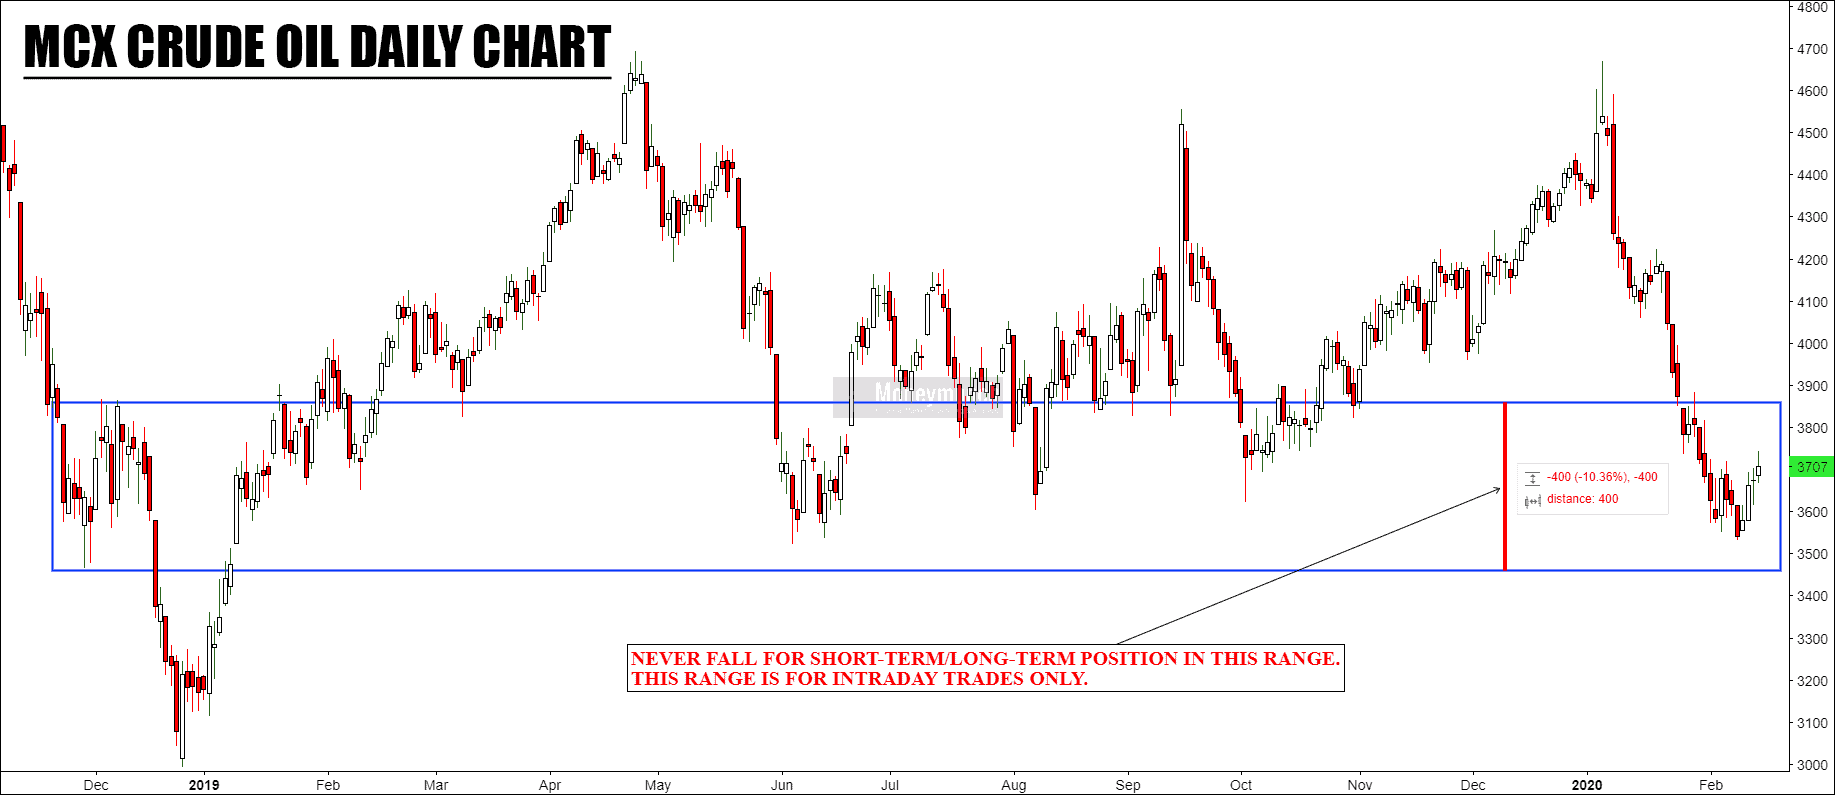
New Update: What’s next in crude oil?
If crude oil remains below to 3420, get ready for 3360 – 3260 – 3200 – 3120.
Otherwise, it will follow February 16, 2020 range (described in the chart).
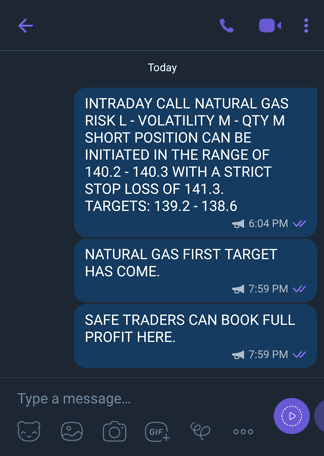
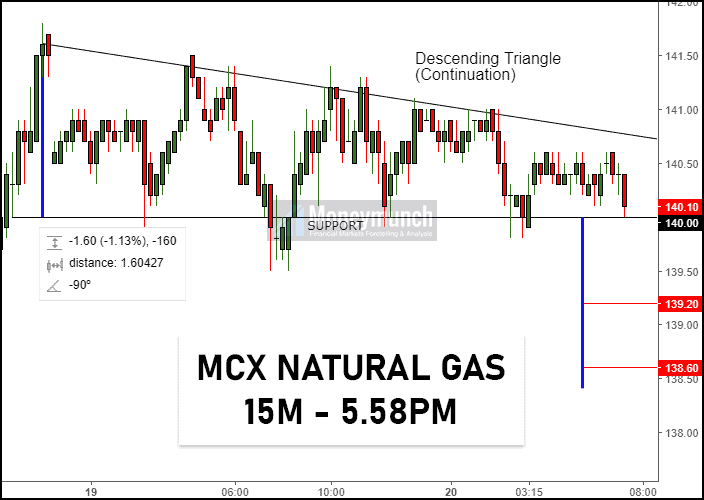
Natural Gas Price Reversal in Progress

Natural gas can fall up to 126.6 – 126 levels. Don’t sell above 128.8 level.
To become a subscriber, subscribe to our free newsletter services. Our service is free for all.
Continue reading
 Unlock This Article