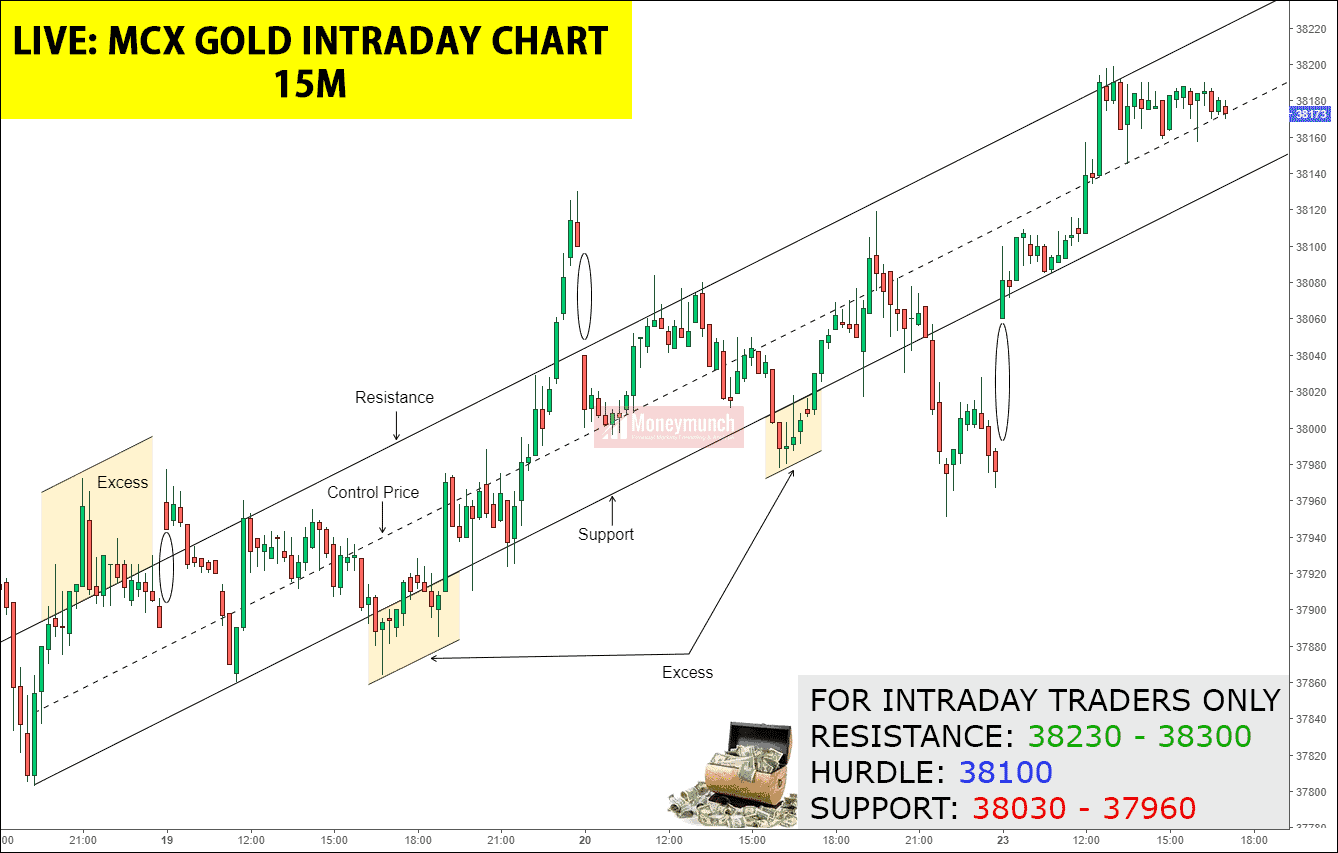
Outlook for Gold – Same but Different
Aluminum Intraday Pull Back in Progress
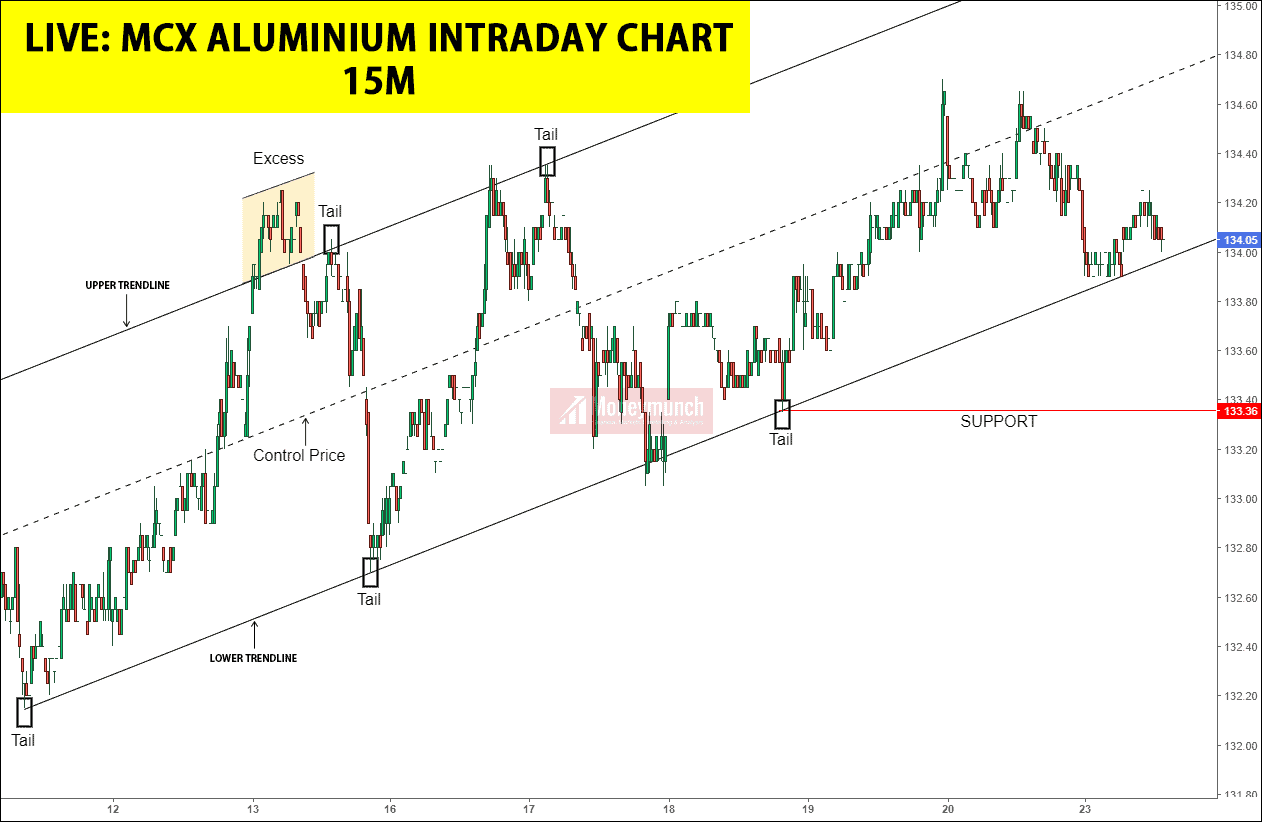
Strong Support: 133.36
Aluminum is taking U-turn from each lower trend line hits. Where’s the tail? Will it keep moving upside from here to 134.6 – 135+ levels?
The support breakout will increase the selling pressure. And it can fall up to 132.8 – 132.2 level.
To become a subscriber, subscribe to our free newsletter services. Our service is free for all.
Continue reading


 Unlock This Article