To become a subscriber, subscribe to our free newsletter services. Our service is free for all.
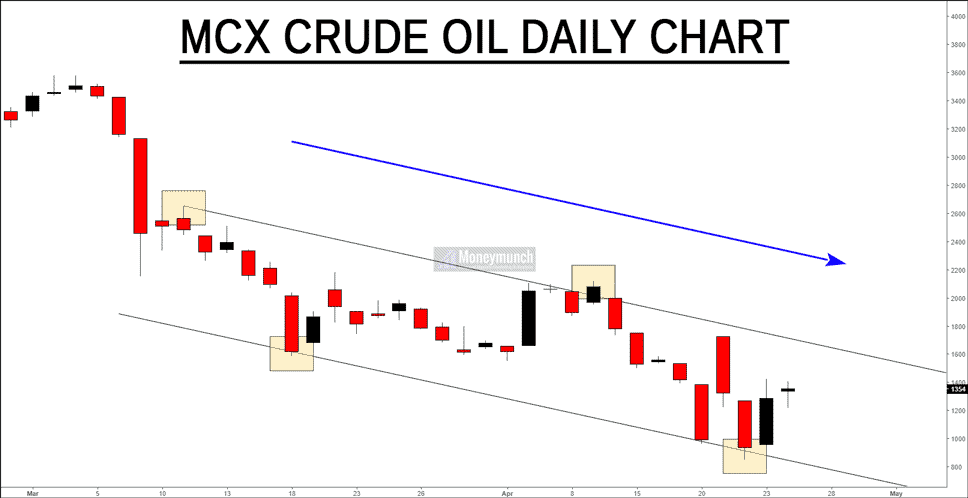
Parallel Channel defined validation, more than 2 price is used to find price point by connecting at least minimum two price in degree.
TCS trading price at DECISIVE zone for further direction: up-break or follow the channel as projection. If price is continue call follow the price Parallel channel, the first target is at 1977 nearby.
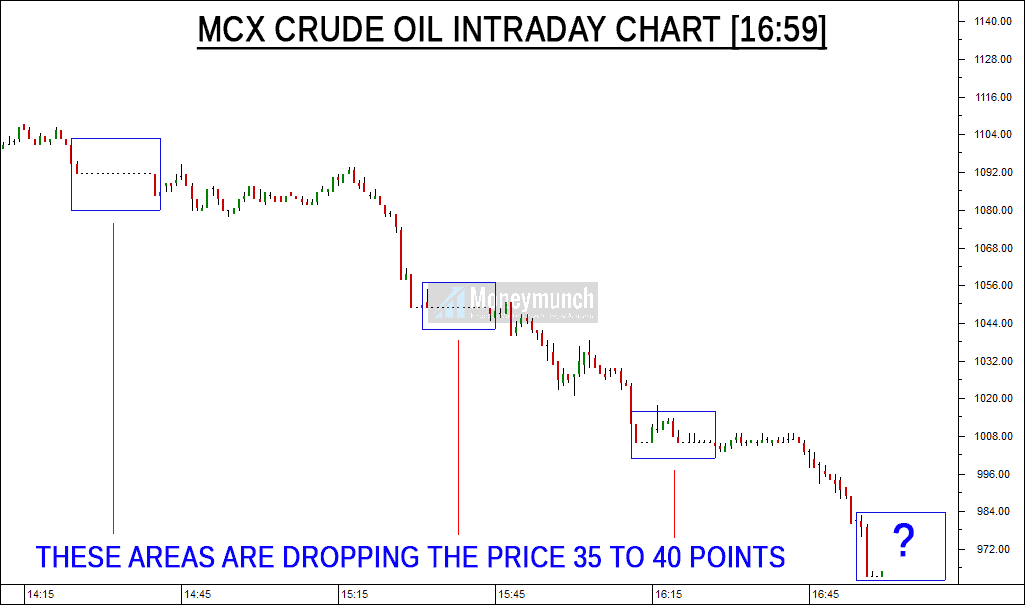
Observation by using PRICE ACTION with Volume:

No INVALID sign of any kind has been seen yet. That’s why we have no clue for selling. In terms of price and volume, the rhythmic seems moving. Possibility for up-break out or wait for sign of invalid candle.
Continue reading
 Unlock This Article