What’s Next for NCDEX Jeera & Cotton Price Trend Forecast

commodity jeera tips chart

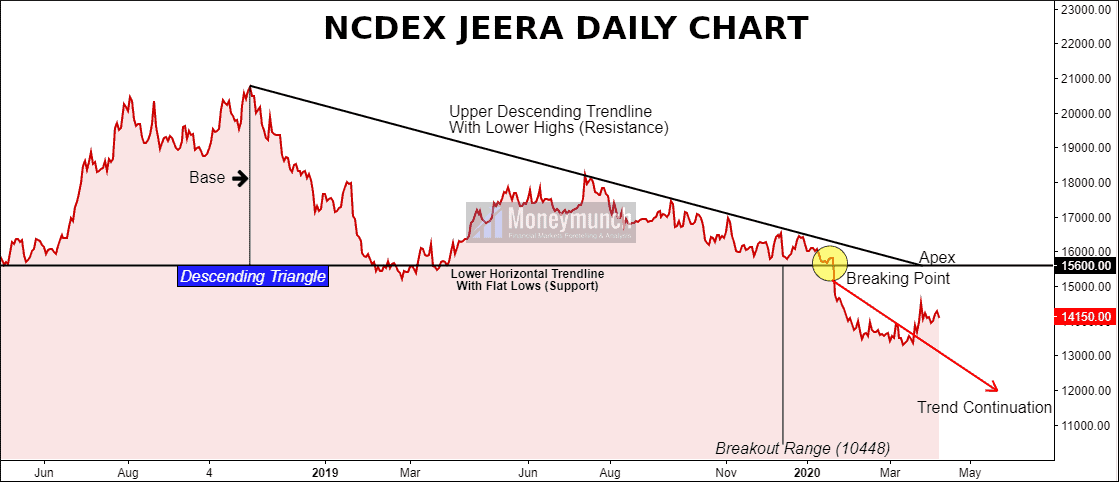
Price Range: 5152
Breakout Range: 15600 – 10448
A short reversal started from the 13110 levels.

Short-term Trend Analysis:

MCX Cotton is a sellable script until it remains below 17000 for the target of 15800 – 15000.
Isn’t it enough to know the next move? To become a subscriber, subscribe to our free newsletter services. Our service is free for all.

Continue reading

‘COVID-19’ No More in China BUT Exists in Other Countries

The first case had confirmed in China Wuhan city. But the current state will give you a shock.

Last updated: April 08, 2020, 12:17 GMT
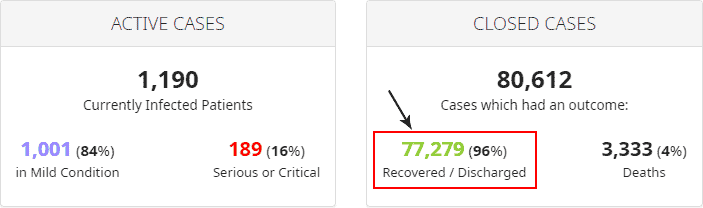
Coronavirus Cases: 81,802
Deaths: 3,333
Recovered: 77,279

Active cases & closed cases China

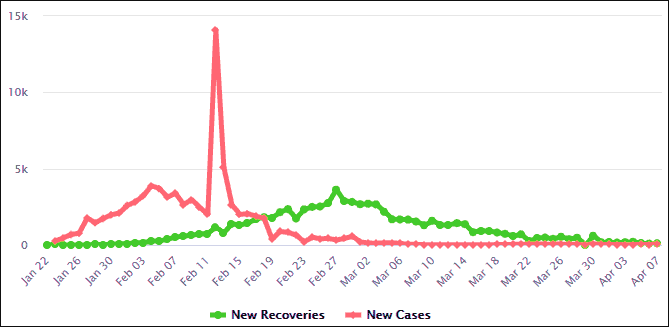
Coronavirus: New Cases vs. New Recoveries

New Cases vs Recoveries China

The above state shows the situation is under control in China, and Wuhan city reopened. More

China Ends Wuhan Lockdown, but Normal Life Is a Distant Dream
Published April 7, 2020 | Updated April 8, 2020, 1:01 a.m. ET
By Raymond Zhong and Vivian Wang
– nytimes.com

How they recovered?

  • China reveals residents are following the Government’s lockdown advice: brutal but effective
  • China had deployed remote-controlled mini-tanks for disinfectant-spraying on an entire city.

    We began using them for disinfection and disease prevention,” said Hou Yongfei, deputy secretary-general of the Shanxi Province Unmanned Vehicle Association, the outlet reported, citing AsiaWire.

  • China implements a new Orwellian mass surveillance tool and a ‘close contact’ app.
  • Social distancing, physical distancing, and by following all safety precautions of WHO.

Wuhan recovery gives hope to rest of world, says WHO

Coronavirus disease situation data (up to 8 April)

This report provides the latest global number and numbers by country of COVID-19 cases. Continue reading

NSE Nifty Research For You

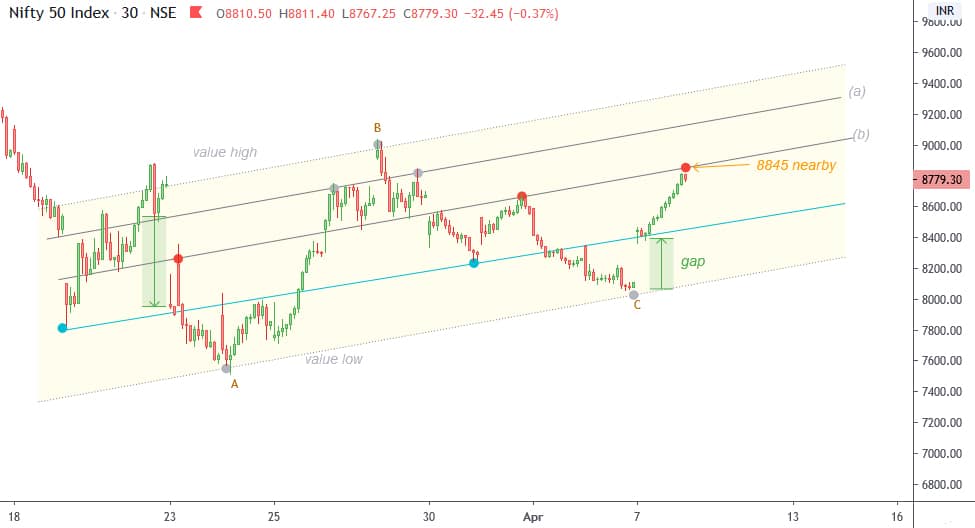
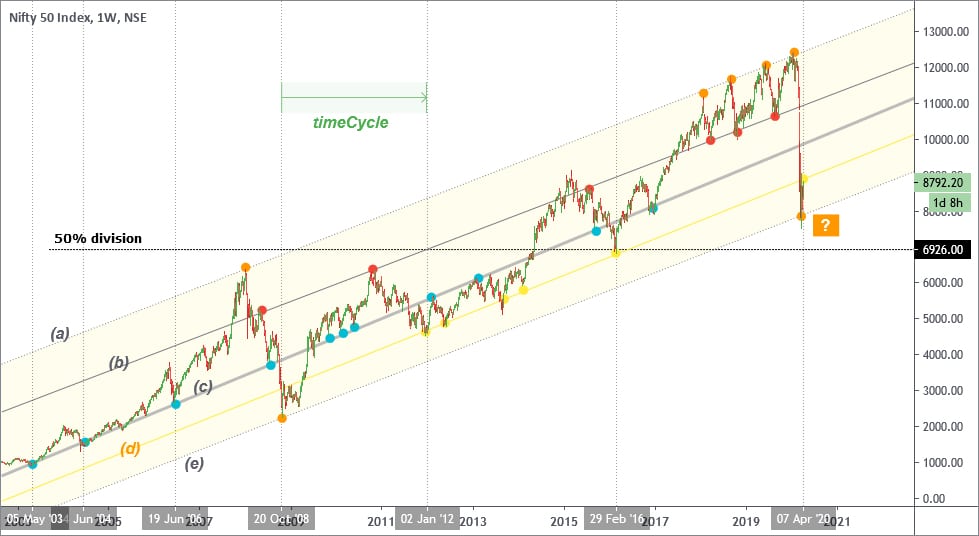
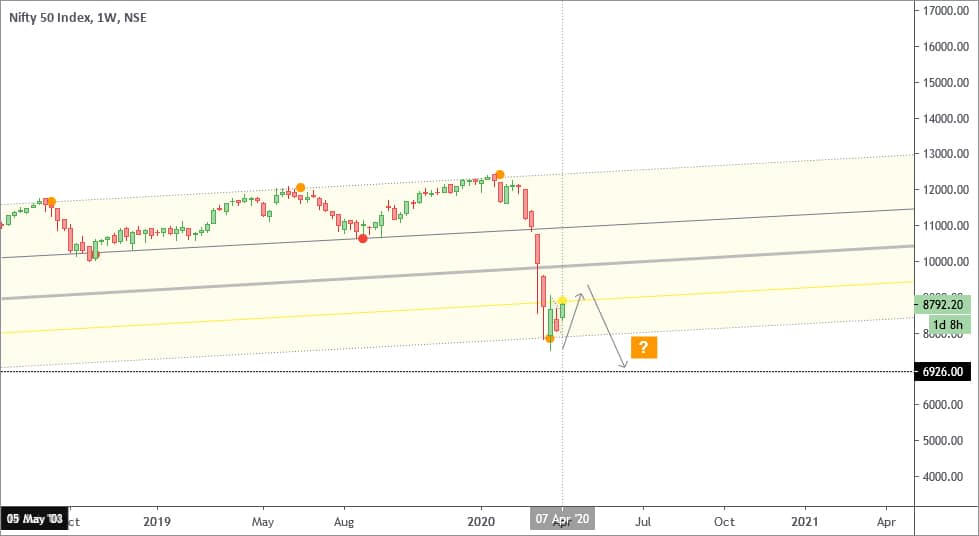
This channel still not confirmed completely. 8836 is resistance to push price 180-300 points -ve.

We created a parallel channel by looking at market (a), (b)…(e). If you look at this chart and drawing minutely, then you will found that where are maximum points(dots). That is called gravitation to attract the price value. In the future, while the pullback price tries to test this line in the coming days.

The price very near the yellow gravitating line ()yellow which is 8912 nearby.

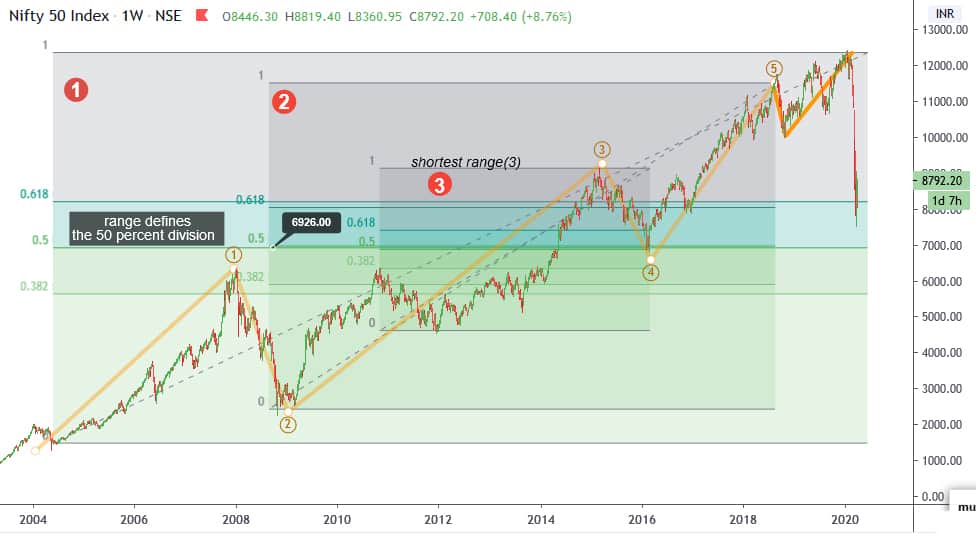
  • three market ranges (1,2,3) which range defines
  • the 50 percent division at 6926.8.

To become a subscriber, subscribe to our free newsletter services. Our service is free for all.

Continue reading

Nifty, SGX NIFTY, GOLD…

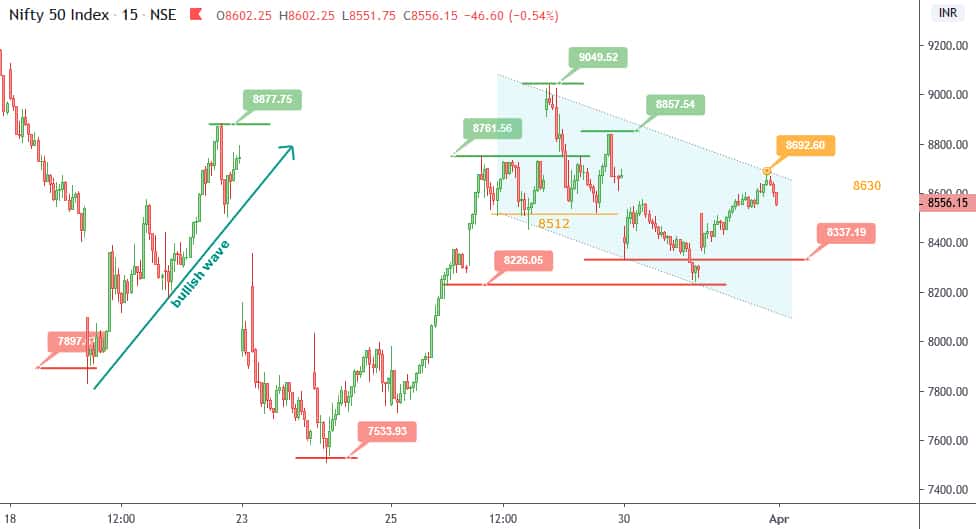
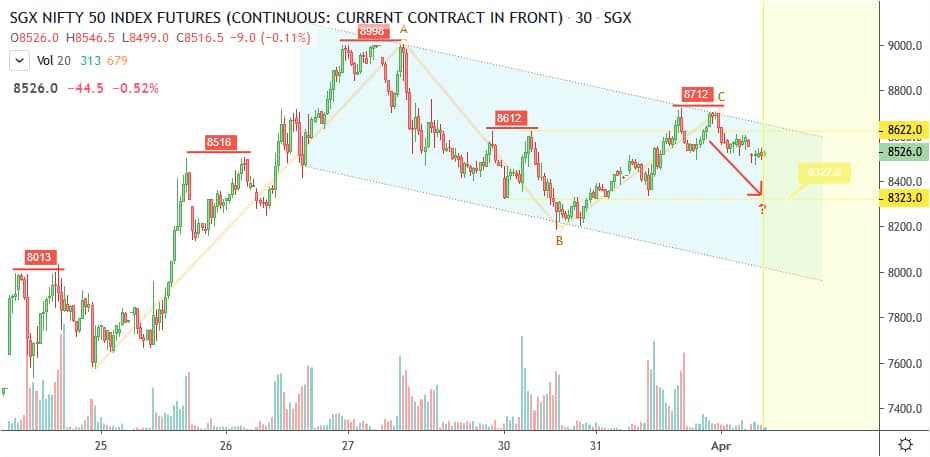
As per the channel, two resistance can push the price toward 8515 and 8340 follow by Resistance 8592-8632 Almost all major resistances and supports are plotted on the chart.  If price close above 8620 above, then I will update fresh chart.

8323 targets then, price will not break or close 8622. In case of break & close above 8612, then channel will not continue.

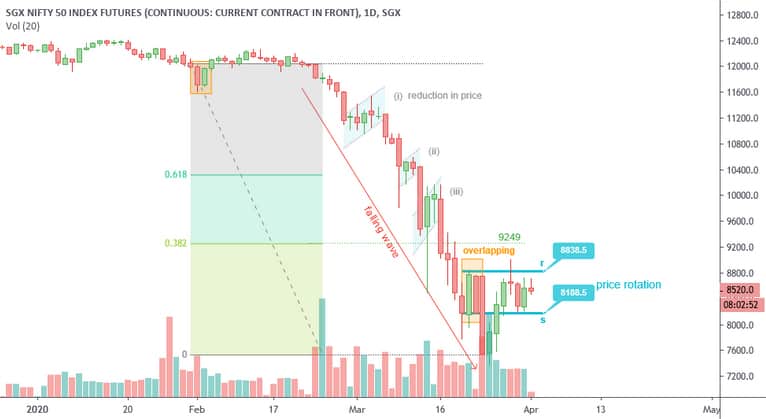
Daily chart for SGX Nifty:

  • During the falling wave, ⁣ 3 times reduction in price has been seen.
  • While using the retracement, 32.2% retraced is at 9249.
  • Price rotation range is between 8838 and, 8188.

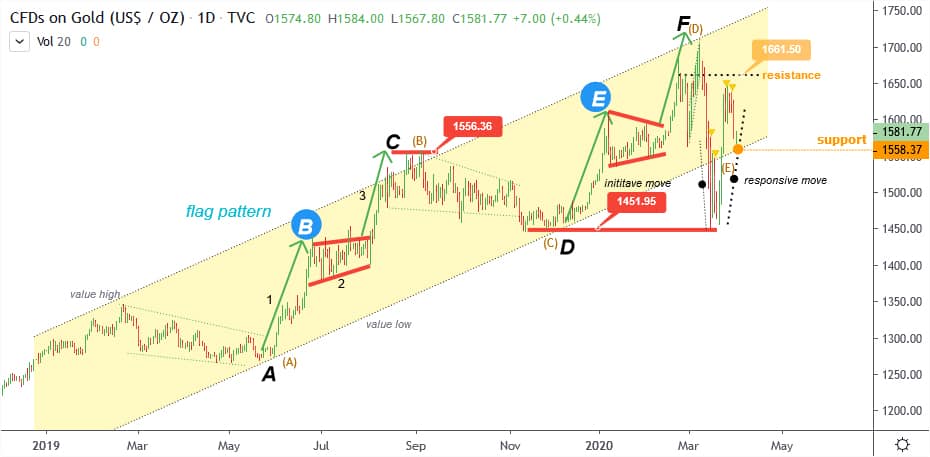
Almost many things are till remaining on the chart, although I have plotted the following:

  • Flag pattern
  • Major and minor channel
  • Initiative move
  • Responsive move
  • major and minor support level
  • Waves

Channel support 1559 nearby for GOLD .

To become a subscriber, subscribe to our free newsletter services. Our service is free for all.

Continue reading

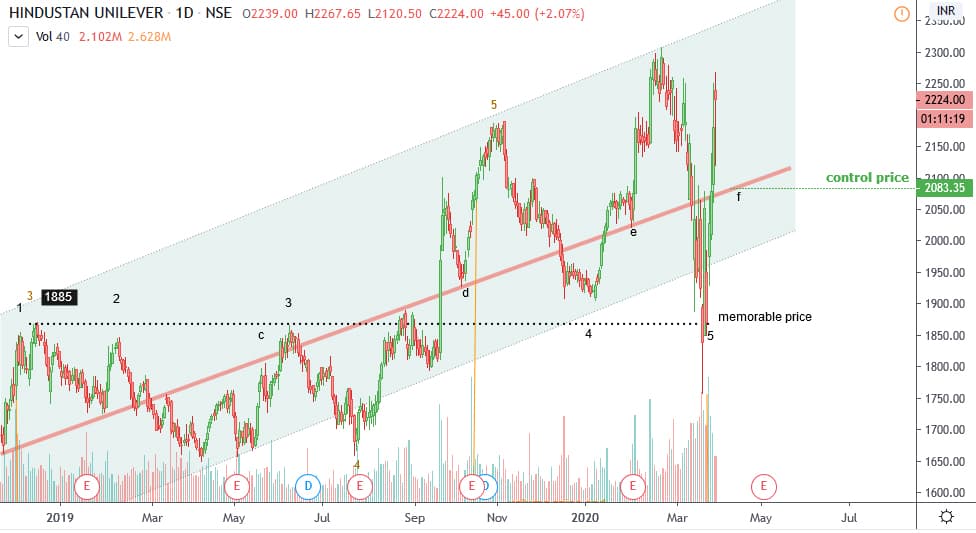
NSE Nifty & HINDUNILVR, Trade Setup

In the last updatation for the nifty, I have written with the channel that “I am not bullish below 8130”. Same day nifty was crossed this level and fired up to 9038. This morning I have created NIFTY and HINDUNILVR.

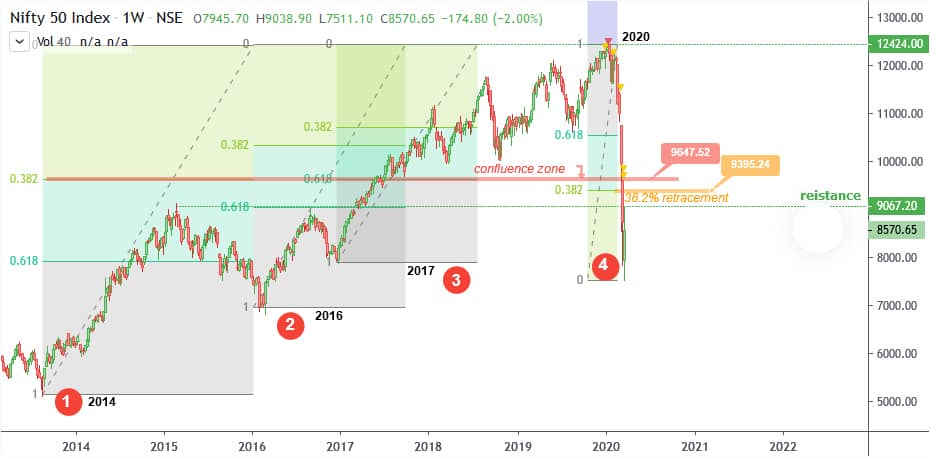
The mainly four Fib. Retracement are applied in different years.

  • Confluence zone at 9647.
  • 38.2 retracement level is at 9395
  • previous resistance and 61.8% retracement level at 9067.

The question is how to understand and use these levels?

Answer; There is always pullback whether there is a stock or market. If there is normal good new, then pullback easy can be 38.2% retracement. Though the confluence zone is the memory of investors, here is 9647 attract to investors. Above all given levels are actionable for traders and investors. I would like to add GAP theory on with retracement in another chart.

Control price attraction is the easy target 2083 nearby for short-sellers.

Best short-selling points

  • First @2221
  • Second @2255

Thanks all who are supporting my post. To become a subscriber, subscribe to our free newsletter services. Our service is free for all.

CLOSE VIEW:

Continue reading

Alert! Nifty Won’t Bullish Still

For Subscribers, in last this month almost more than 1700 points profit has been taken by us over the Nifty future trades. To become a subscriber, subscribe to our free newsletter services. Our service is free for all.

Intraday Resistance at 8047

8130 nearby strong resistance at value high.
If U-turn exist with new low, target will be 7330 nearby and targets of control price is at 7107.

As far as crossing the level 8330, I won’t speak about bullish.

Continue reading