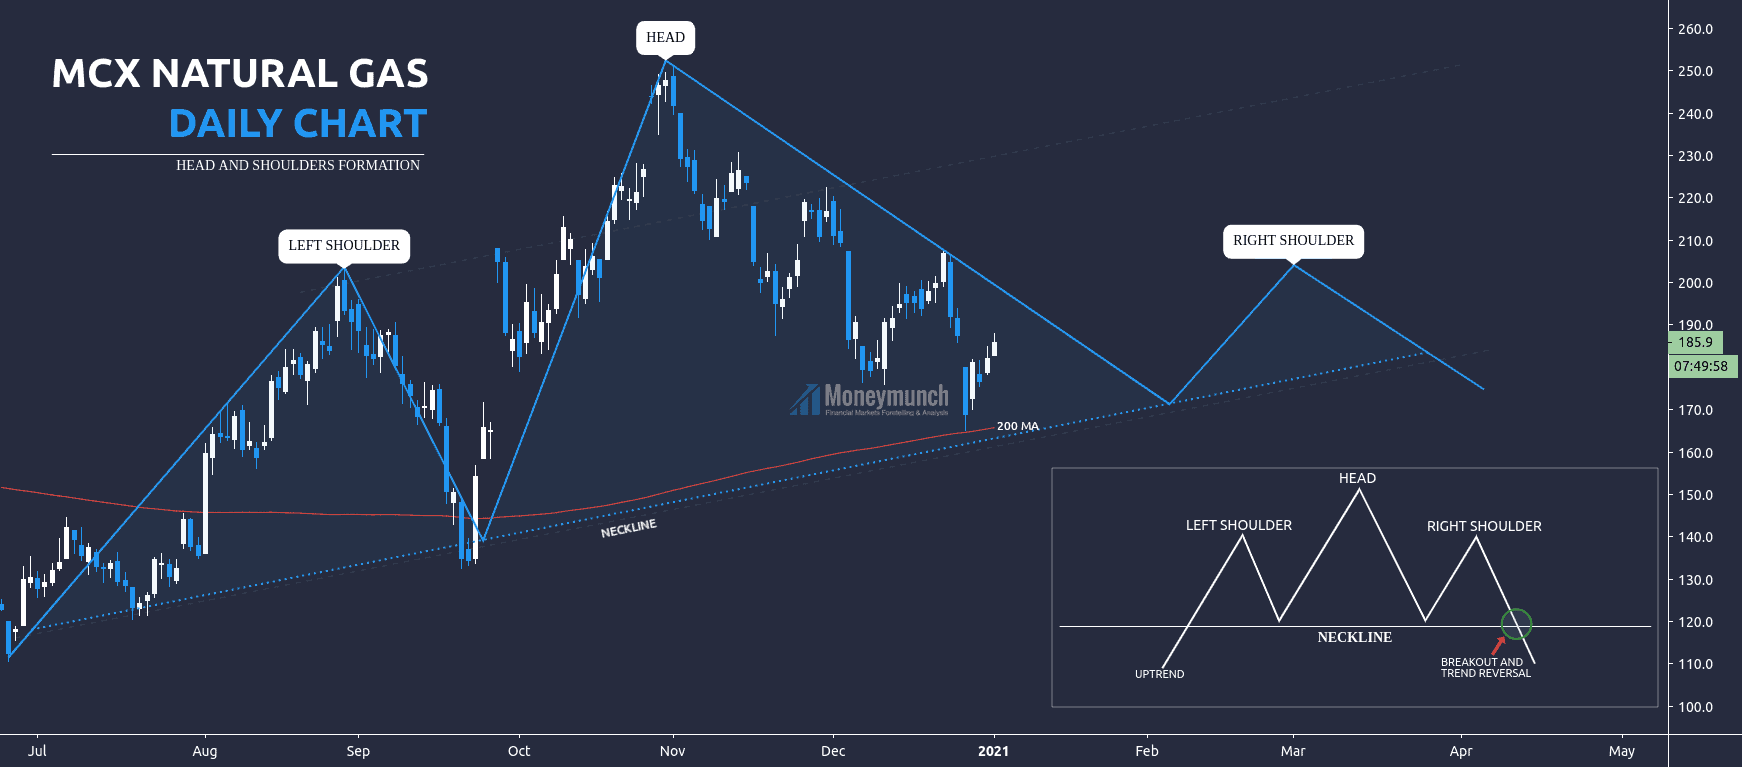
MCX Silver: Intraday trading strategy & tips

free commodity silver 15 min chart tips

This is MCX Silver mini 15 minutes chart. I have used here moving average, Fibonacci, DMI, and RSI.

Fib Levels: T 71496 and B 65664

Silver will try to touch 0.382 (67892) from here. It will act as resistance. Moreover, there is a 50 MA. If silver breaks both, it will fly from there and touch, 68580 levels. Intraday traders can play between it.

But if it takes a U-turn from 50 MA and breaks the 20 EMA, be ready for the following targets: 67060 – 66600.

To become a subscriber, subscribe to our free newsletter services. Our service is free for all.

Continue reading

The Bat Pattern on the NIFTY

The “Bat pattern” incorporates the 0.886XA retracement, as the defining element in the Potential Reversal.
The B point retracement a 0.50 of the XA leg. The Bat utilizes a minimum 1.618BC projection, which is already done.
In addition, Bat pattern is extended to a 1.618 AB=CD calculation. It is an incredibly accurate pattern and requires a smaller stop loss than most patterns.

By keeping stop-loss as 13747 sell NIFTY,  TARGET can be 13536 2nd targets 13403  or still down.
To become a subscriber, subscribe to our free newsletter services. Our service is free for all.
Continue reading

Negative Sign at Longer TF for NIFTY

The price is trading the upper band of the channel which is resistance but nifty can create penetration(excess2) because of excess1 at lower band.

To become a subscriber, subscribe to our free newsletter services. Our service is free for all.

Continue reading

Time to Pick MCX Crude Oil (INTRADAY)

free commodity crudeoil daily chart tips

According to the daily chart of MCX crude oil, it is further advance for short-term investors. The retracement level of 0.618 is a perfect entry-level.

In the previous update of crude oil, we have recommended buying many times.

As per RSI & MA, it seems bullish . We will see soon target 1 and target 2 price after a short reversal.

But if you want to see a clear trend, we’d see it in a 4 hours chart:

free commodity mcx crudeoil 4hrs chart & tips

According to the 4H chart of MCX crude oil, it’s sharply moving upward. It’s safe for intraday & short-term traders to take a position nearby the support trendline or 50 MA for the targets of 3600 – 3660 – 3700 – 3800.

But what if it breaks the support trendline? DMI is indicating collapse ahead. How much crude oil can come down after breaking out the support trendline? To become a subscriber, subscribe to our free newsletter services. Our service is free for all.

Continue reading

MCX Gold & Silver Spot Prepare For Another Price Advance

free commodity gold daily tips chart

Determining the MCX Gold Price Next Big Move

According to this chart, gold has started falling from August month. Doji appearing in the last trading session. It’s signaling a possible reversal. If gold follows the dynamic resistance, we may see a continuous downtrend. That can be up to 0.5 (47300) to 0.618 (45200) of Fib retracement.

Fib retracement (reverse):
Swing High: 56191
Swing Low: 38400

Here’s ADX less than 25, and +DI is above the -DI . Additionally, 200 MA & 50 MA is throwing uptrend signals. If we follow the moving average, gold may try to hit 51000 – 51990 (0.236) levels.

Intraday traders should watch dynamic resistance before entering.

free commodity silver spot chart signals

Silver Follow Up & Future Predictions For 2020 & 2021 – Part I

Here I have used Gann fan and Fibonacci on Silver sport to identify the current trend.

Fib Retracement:
Top: $29.90
Bottom: $11.64

If silver remains above the 78.6% level, the target will be $27 – $27.8

And if it goes inside 8/1 or remains below 78.6% level, we will see the silver price at 0.618 value of fib retracement. The day traders can use the following levels as targets: $25 – $24 – $23

According to DMI, ADX is less than 25 but turning up. And +DI is signaling an upside rally. Technically, silver is a further advance.

For advance traders, watch significant releases or events that may affect the movement of gold , silver & crude oil:
Monday, Dec 21, 2020:

  • 12:00 – Gold Index

Wednesday, Dec 23, 2020:

  • 3:00 – API Weekly Crude Oil Stock
  • 21:00 – Crude Oil Inventories, EIA Refinery Crude Runs (WoW), Crude Oil Imports, and Cushing Crude Oil Inventories
  • 21:30 – Natural Gas Storage

To become a subscriber, subscribe to our free newsletter services. Our service is free for all.

Continue reading

Simple TimeCycle and Parallel Channel, NIFTY

nifty-timecycle

There is still not worry about long positional trader until the price would not fall below 13397 and Support 13000. To become a subscriber, subscribe to our free newsletter services. Our service is free for all.

Continue reading