MCX Gold – Setup Final Opportunity

free commodity gold tips & chart

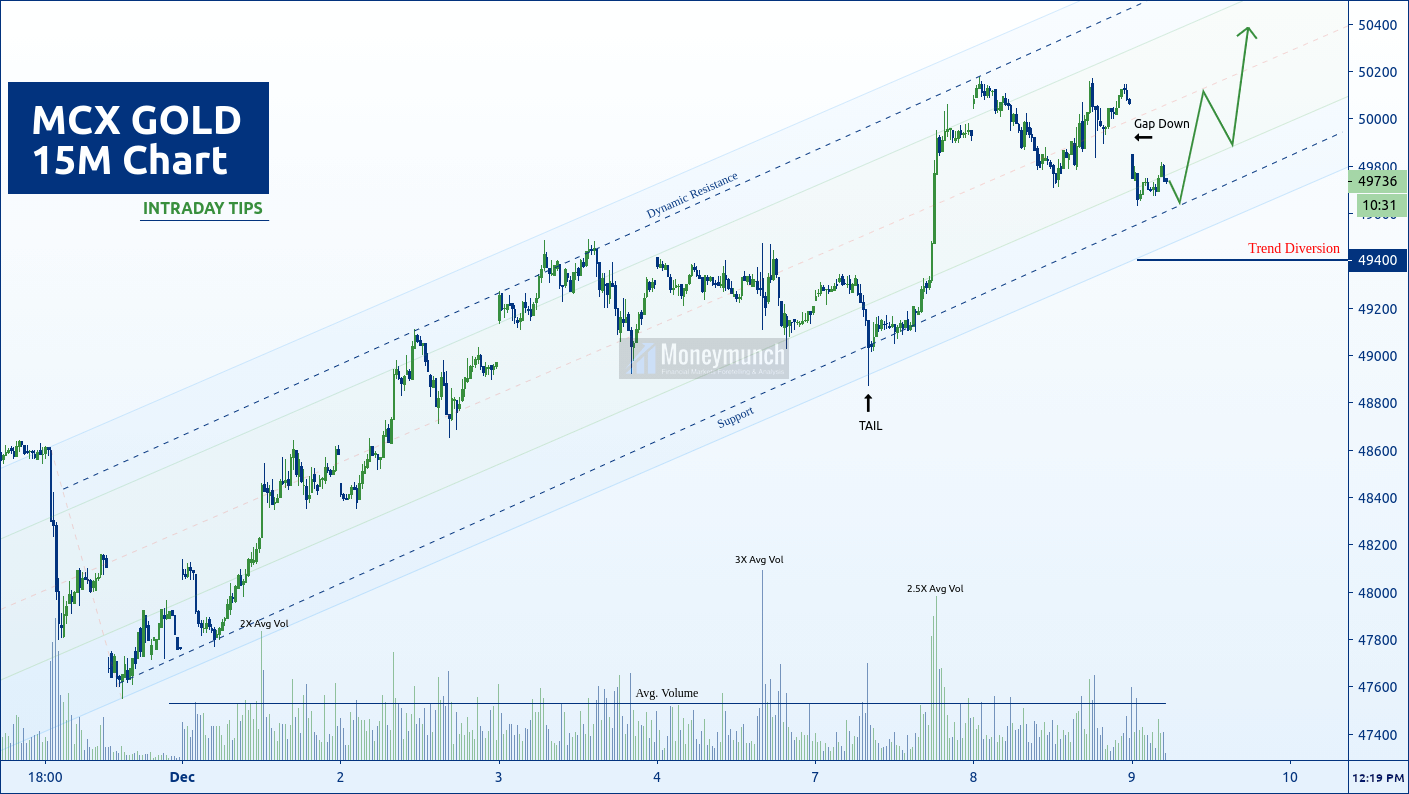
According to this chart, gold is further advance. Intraday traders can see 49860 – 50000 levels soon. We may see 50200 – 50400 in extension before the weekend.

If gold breaks the support trendline, gold can collapse up to the trend diversion point (from 49560 to 49400 levels). Speculators can enjoy both rides.

Once it breaks the support trendline, I will update you.

Note: gap acts as resistance.

To become a subscriber, subscribe to our free newsletter services. Our service is free for all.

Continue reading
Will Zinc Return at a Strong Support Trendline?

free commodity zinc tips chart

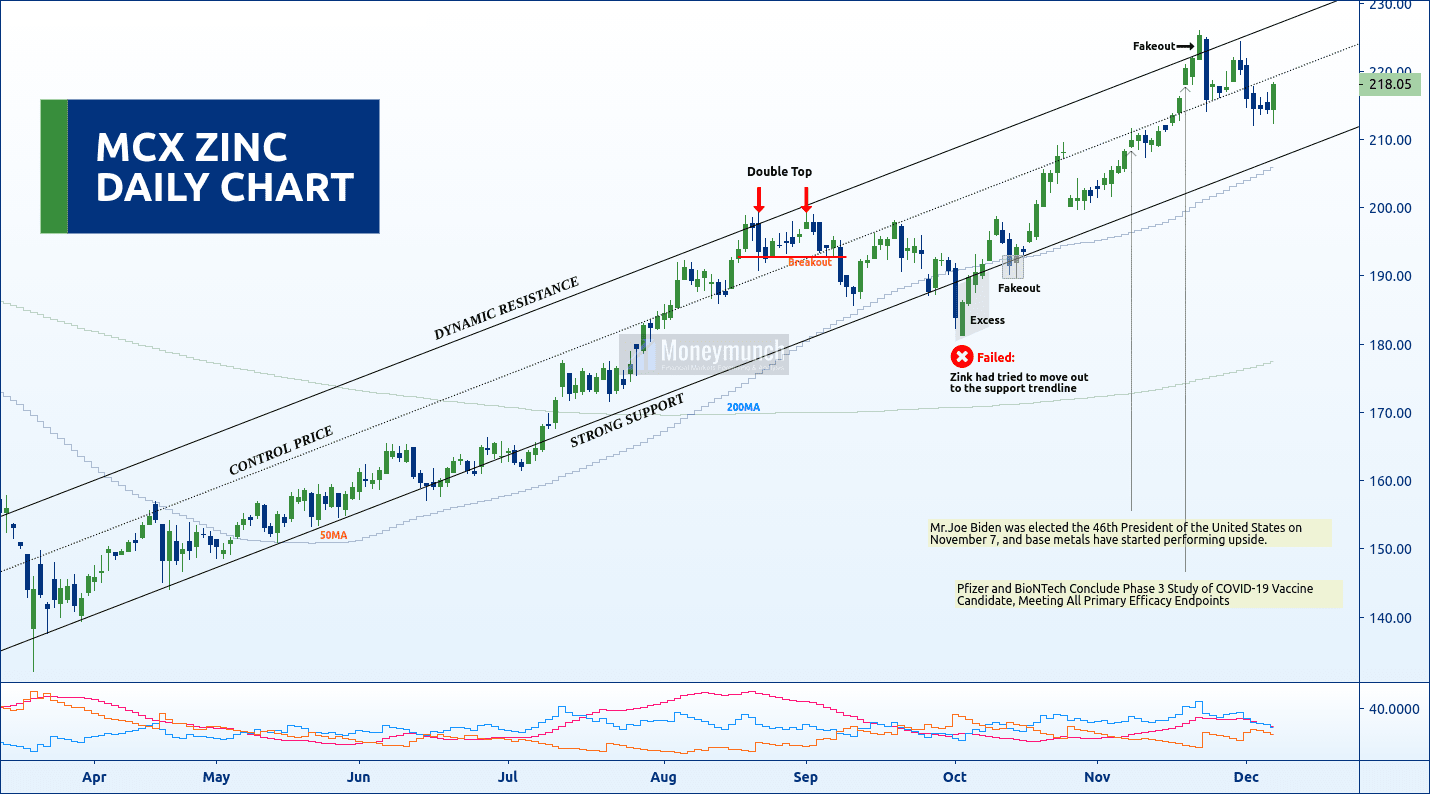
Zinc took a bounce back from the lower levels yesterday, and it has failed to break last week’s low level of 212.1. Intraday traders can initiate long positions for levels of 219.6 – 220.

If it breaks last week’s low, we may see 210 – 208.6 levels. Overall, it’s positive. Long positions can be initiate with targets at 221.6 – 224 – 230 in extension.

The DMI & MA is bullish and calls for further advance.

To become a subscriber, subscribe to our free newsletter services. Our service is free for all.

Continue reading
Nickel’s Strong Buy Signal for Short-Term

free commodity nickel chart tips

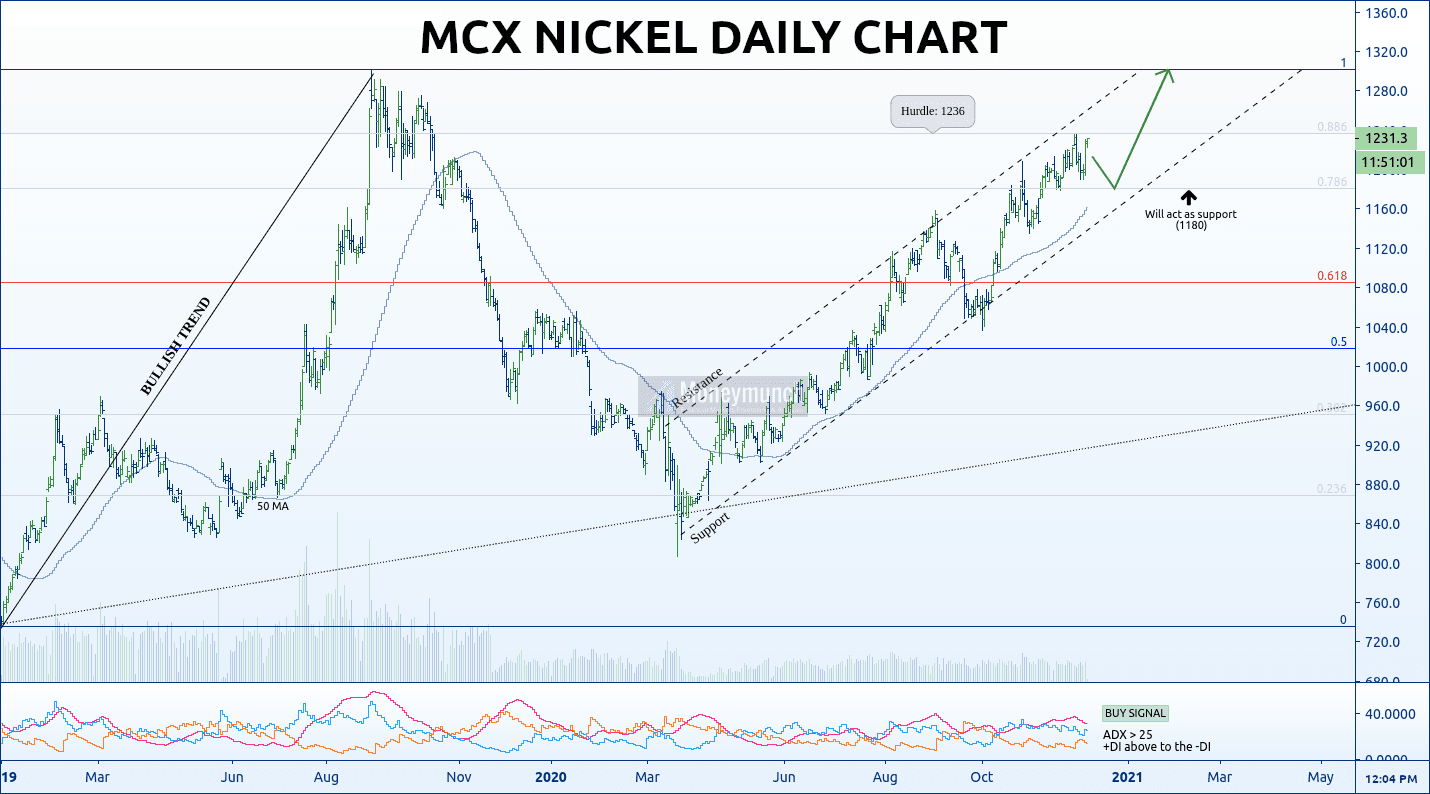
According to this chart, nickel is further advance. Once it breaks the hurdle, it will start marching for 1260 – 1280 – 1300 levels.

Hurdle: 1236

Whenever it hits the hurdle level, what will happen? Here, it will act as resistance. We may see reversal up to the support line (1212 – 1180).

Short-term investors can continue position for the above targets. To become a subscriber, subscribe to our free newsletter services. Our service is free for all.

This is part II. You can also refer to the previous report of nickel by clicking here.

Continue reading

Will GOLD Hit the 50000 this Weekend?

free commodity gold tips chart

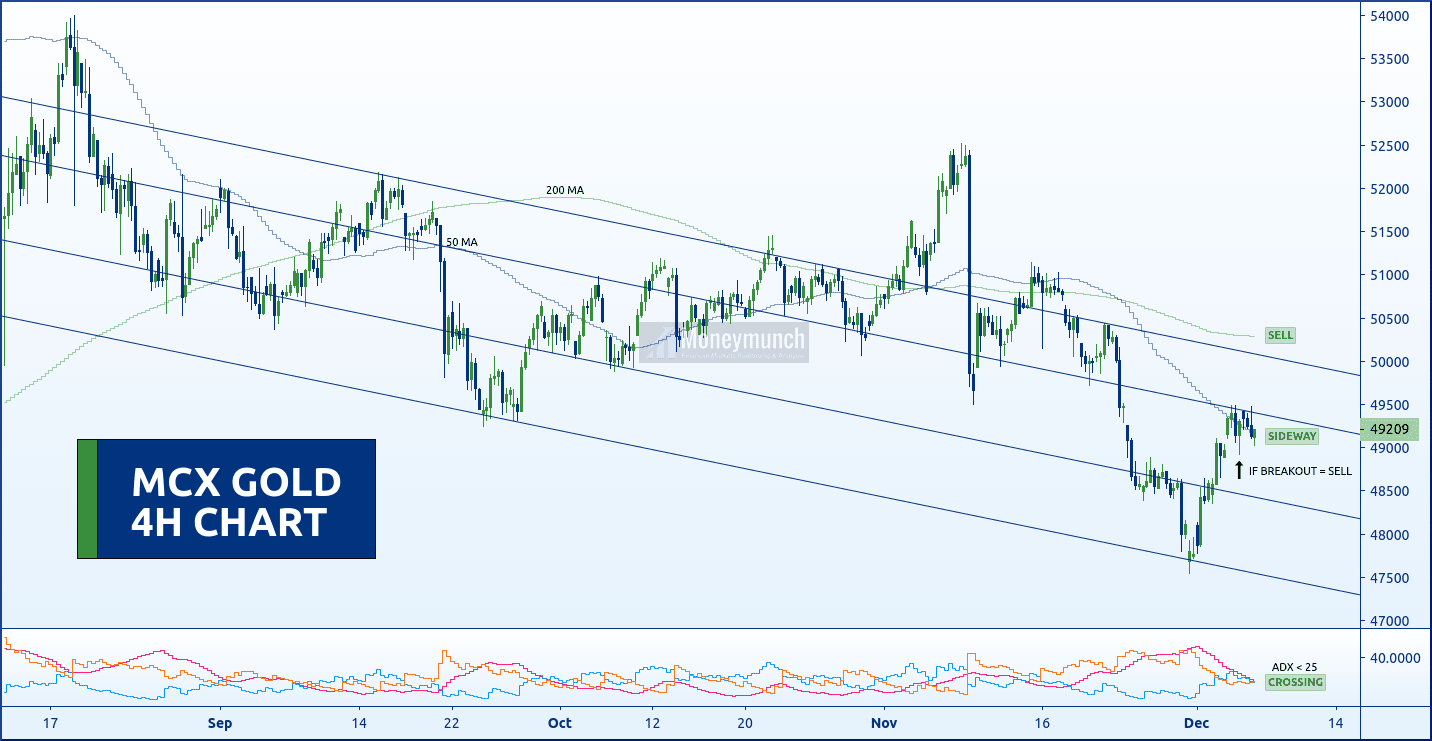
Overall, MCX gold is collapsing. Look at the chart, if it breaks a low of 48924, we may see freefall up to 48500 – 48360.

According to 50 MA, gold will try to push the upside. If we see the gold closing price above the second top of the trendline, it will start rising to the levels of 49760 – 50000.

Here ADX is less than 25 and 200 MA throwing a direct sell signal. Please note the crossing of +DI and -DI before taking a new entry.

To become a subscriber, subscribe to our free newsletter services. Our service is free for all.

Continue reading
MCX CRUDE OIL: Massive Rally is coming soon

free commodity crudeoil chart tips

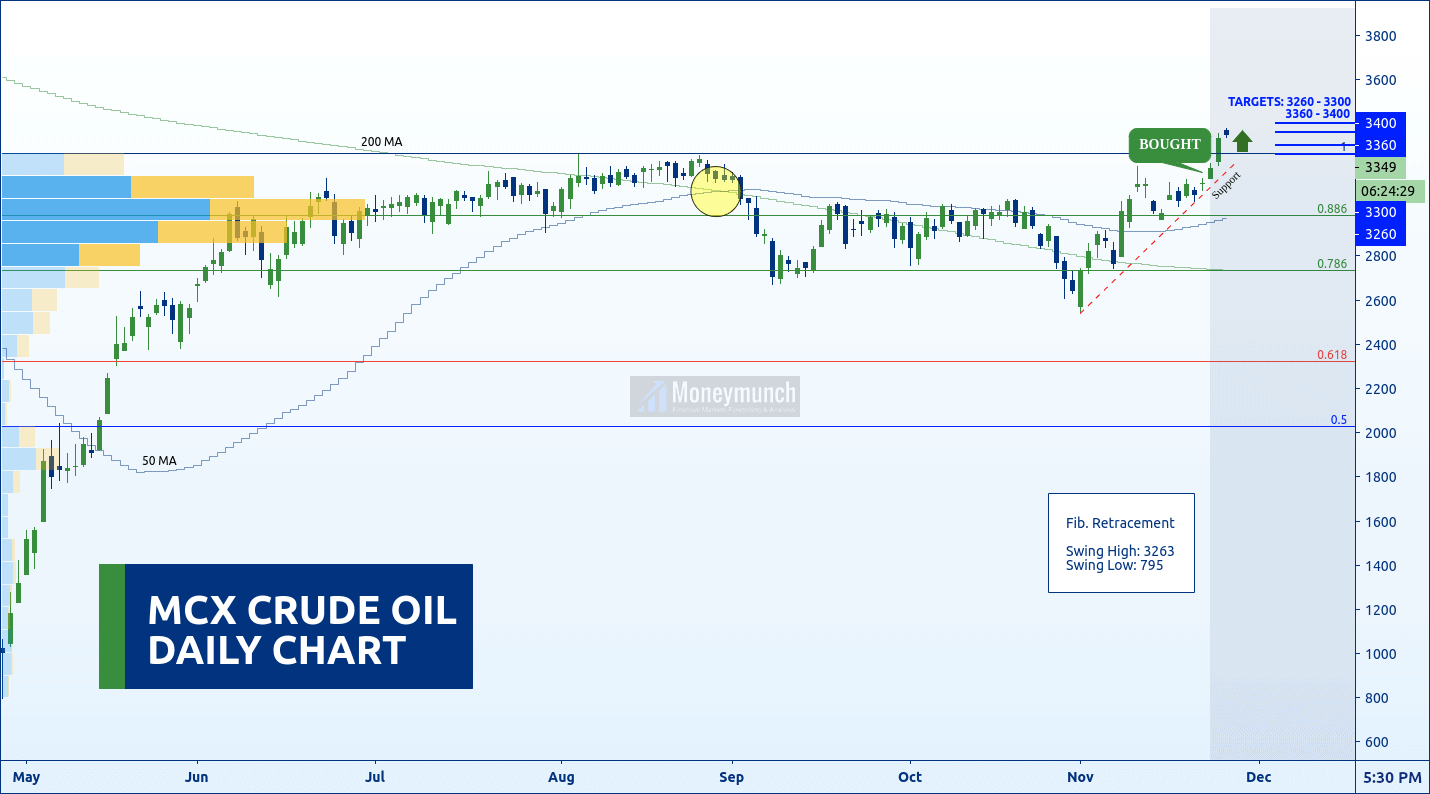
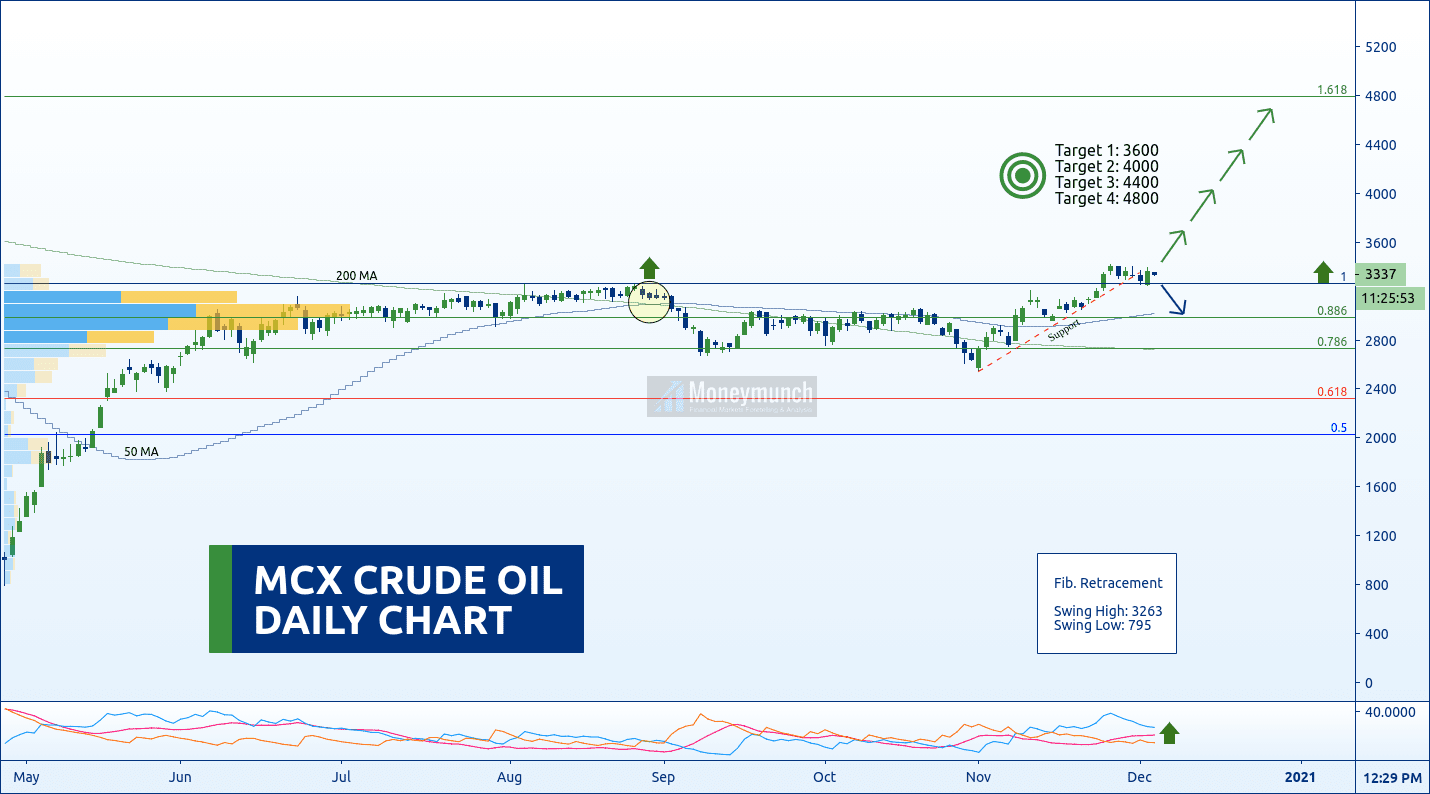
According to this chart, crude oil will keep moving forward and hit the following targets: 3600 – 4000 – 4400 – 4800

Here value 1 of retracement will react as support. And consecutive breakout of this support is a direct sign of a downtrend. It can be up to 0.886 (2982) to 0.786 (2735). You can use it as a target. To become a subscriber, subscribe to our free newsletter services. Our service is free for all.

Continue reading
UPDATE: Identifying the Crude Oil Price Next Big Move

free commodity crudeoil chart callsDid you read my 23 Nov report on crude oil?
Visit here: Identifying the Crude Oil Price Next Big Move

I had written in bold words, “smart investors can buy for 3260 – 3300 – 3360 – 3400 levels”.

free commodity crudeoil tips chart

Crude oil has touched the first three targets by making a high of 3376 levels.

Per lot, we have made a profit of 150+ points (Rs.15,000). What else you want in a free subscription?

To become a subscriber, subscribe to our free newsletter services. Our service is free for all.

Continue reading