Mr.Dev (s)

Mr.Dev(s) is a team of non-biased certified technical and research analysts with extensive experience in the financial markets dating back to 1997. They accurately forecast market movements and position their clients accordingly. They are popular online contributors on many channels and platforms, known for their non-biased advice and commitment to helping investors make informed decisions. The team is also the founder of forex account management services on Moneymunch.com, demonstrating their knowledge and experience in the financial world. Investors can rely on Mr.Dev(s) for research reports and opinions, as well as trading guidance.

Join Today (Free): Commodity Tips | Forex Signals

Positional & Intraday Crude oil Call

free commodity crude oil tips

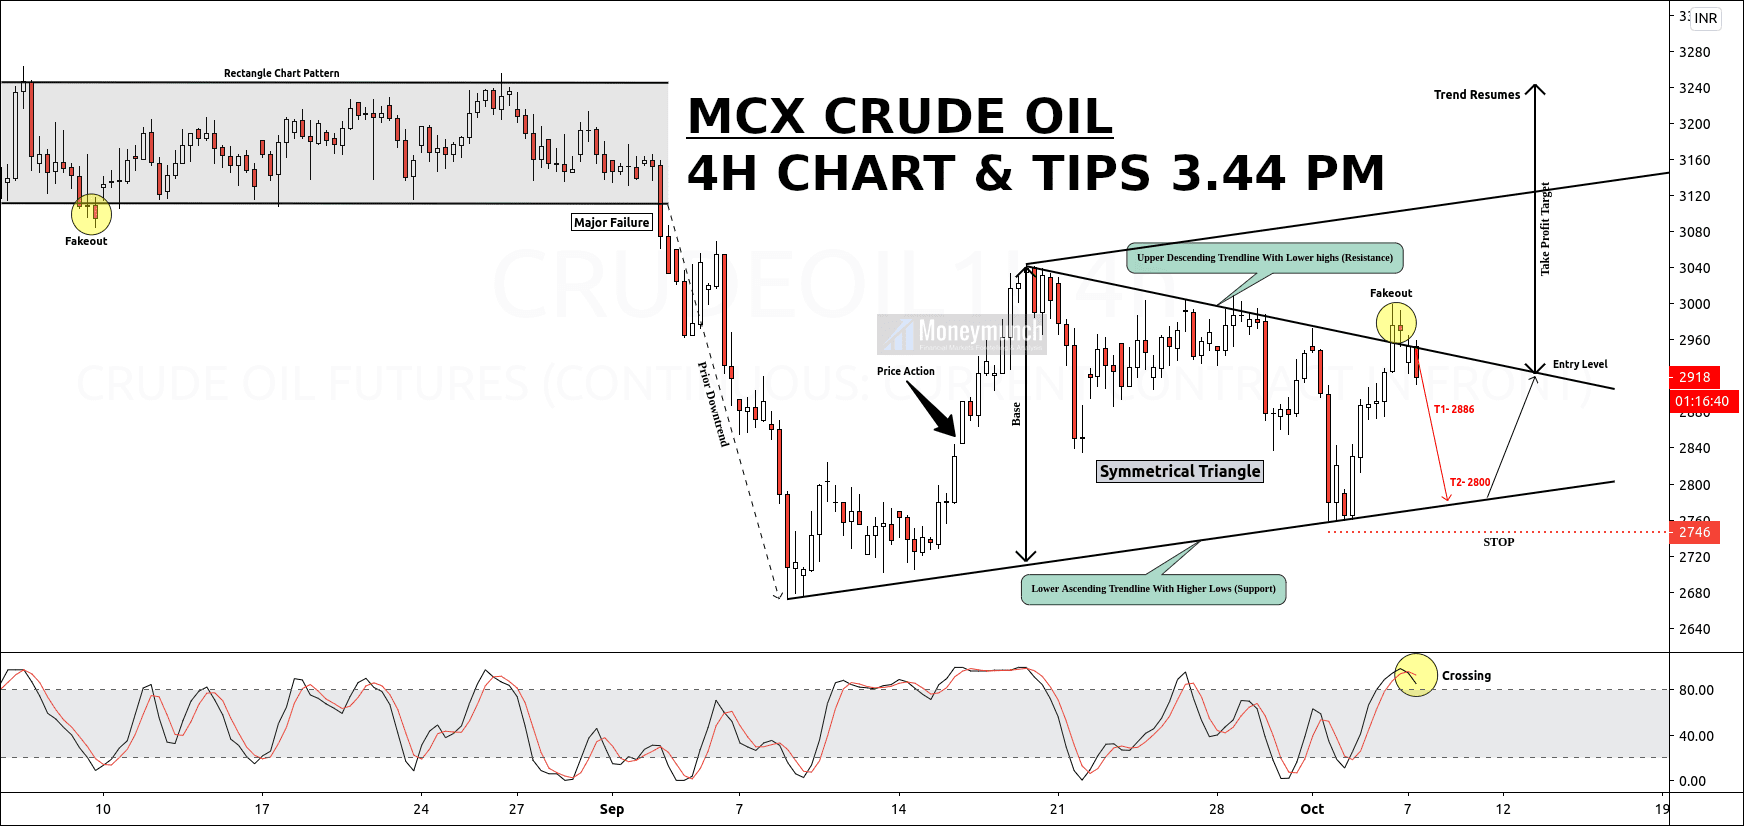
The trend is making a symmetrical triangle.
In the symmetrical triangle, you can see the trend is descending, and it will continue to fall up to the particular targets, which are shown in the charts (T1 2886 & T2 2800).

After knocking the lower ascending trendline with higher lows (support), It will bounce to the upper descending trendline with the lower highs (resistance). After that, If the trend makes consecutive candles, there will be an ascending trend. But don’t sell if the trend falls and crosses the stop loss.

To become a subscriber, subscribe to our free newsletter services. Our service is free for all.

Continue reading
MCX Gold Intraday Pullback Before Acceleration Lower

gold intraday calls hourly chart

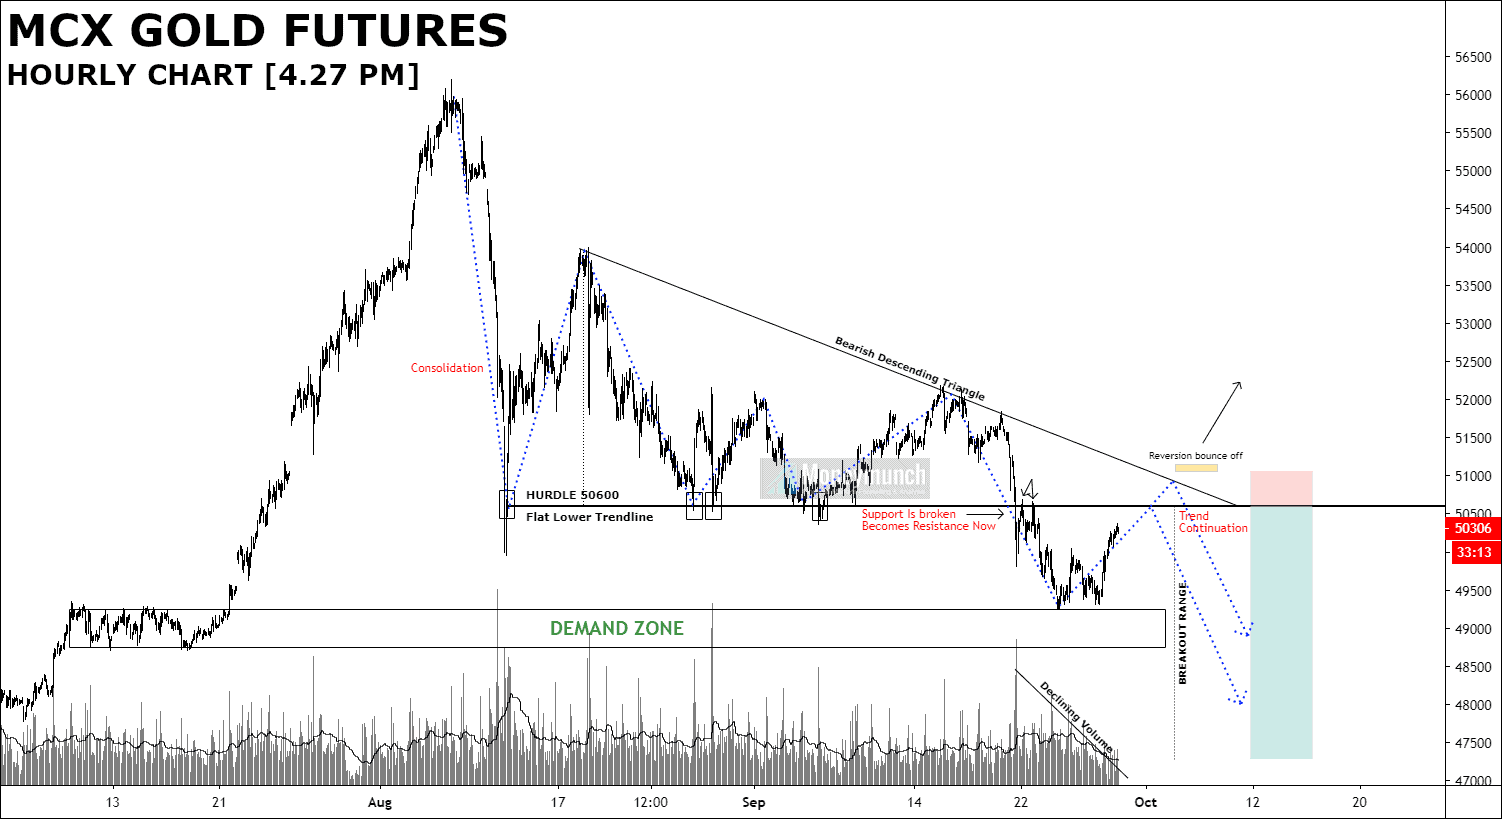
Breakout Range: Approx. 3300 points
Hurdle: 50600 level

At present, gold is trying to recover the previous loss. The support level has broken (flat lower trendline), and it becomes resistance now. We may see the continuation of the downtrend from there. That could fall to the following levels: 49360 – 48760 and below.

Lion heart traders can hold for, 48000 to 47360.

Please don’t mess after a breakout of reversion bounce off level. To become a subscriber, subscribe to our free newsletter services. Our service is free for all.

Continue reading
MCX Nickel Detailed Trend Forecast & Tips

free mcx nickel calls chart

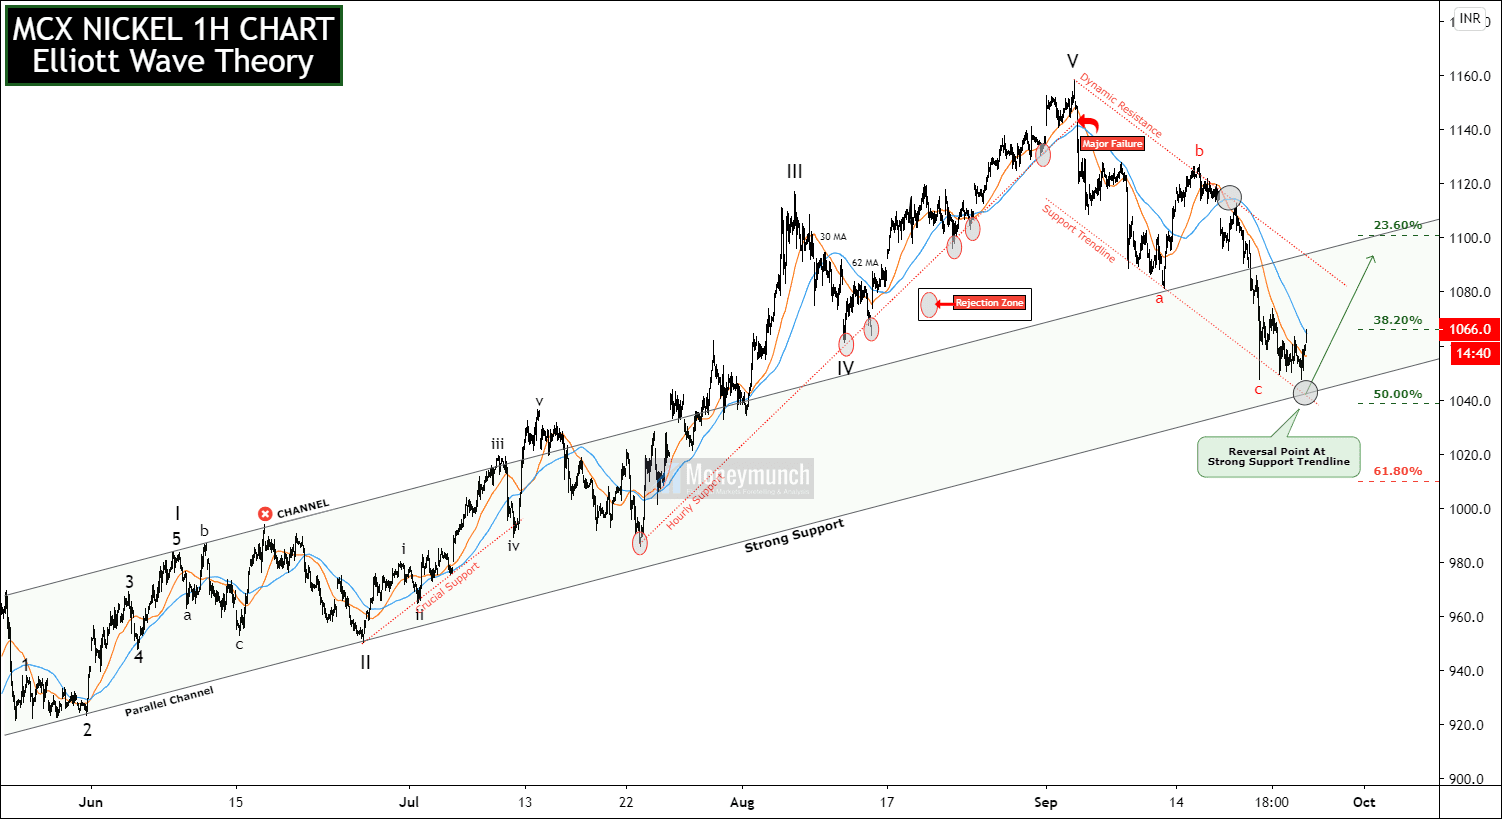
Here, I have used Elliott wave theory, Fibonacci Retracement, and MA (30 & 62) to identify the next move. At present, MCX nickel in a corrective wave. We may see a reversion bounce off here. It can be up to 38.20% to 23.60% of the retracement level. Wherein, 38.20% retracement level will act as a resistance and 50.00% vice versa.

In other words, nickel will start raising for 1076 – 1090 – 1100 level. Dynamic resistance breakout will lead the prices for a 23.60% retracement level. Intraday or positional trader can hold 1080 level.

If nickel breakout the strong support and 50.00% retracement level, don’t buy. That can slip immediately for a 61.80% retracement level.

Also, don’t forget to wait for a crossover of MA 30 & 62.

To become a subscriber, subscribe to our free newsletter services. Our service is free for all.

Continue reading
Aluminium Intraday Tips For Today

free aluminium tips

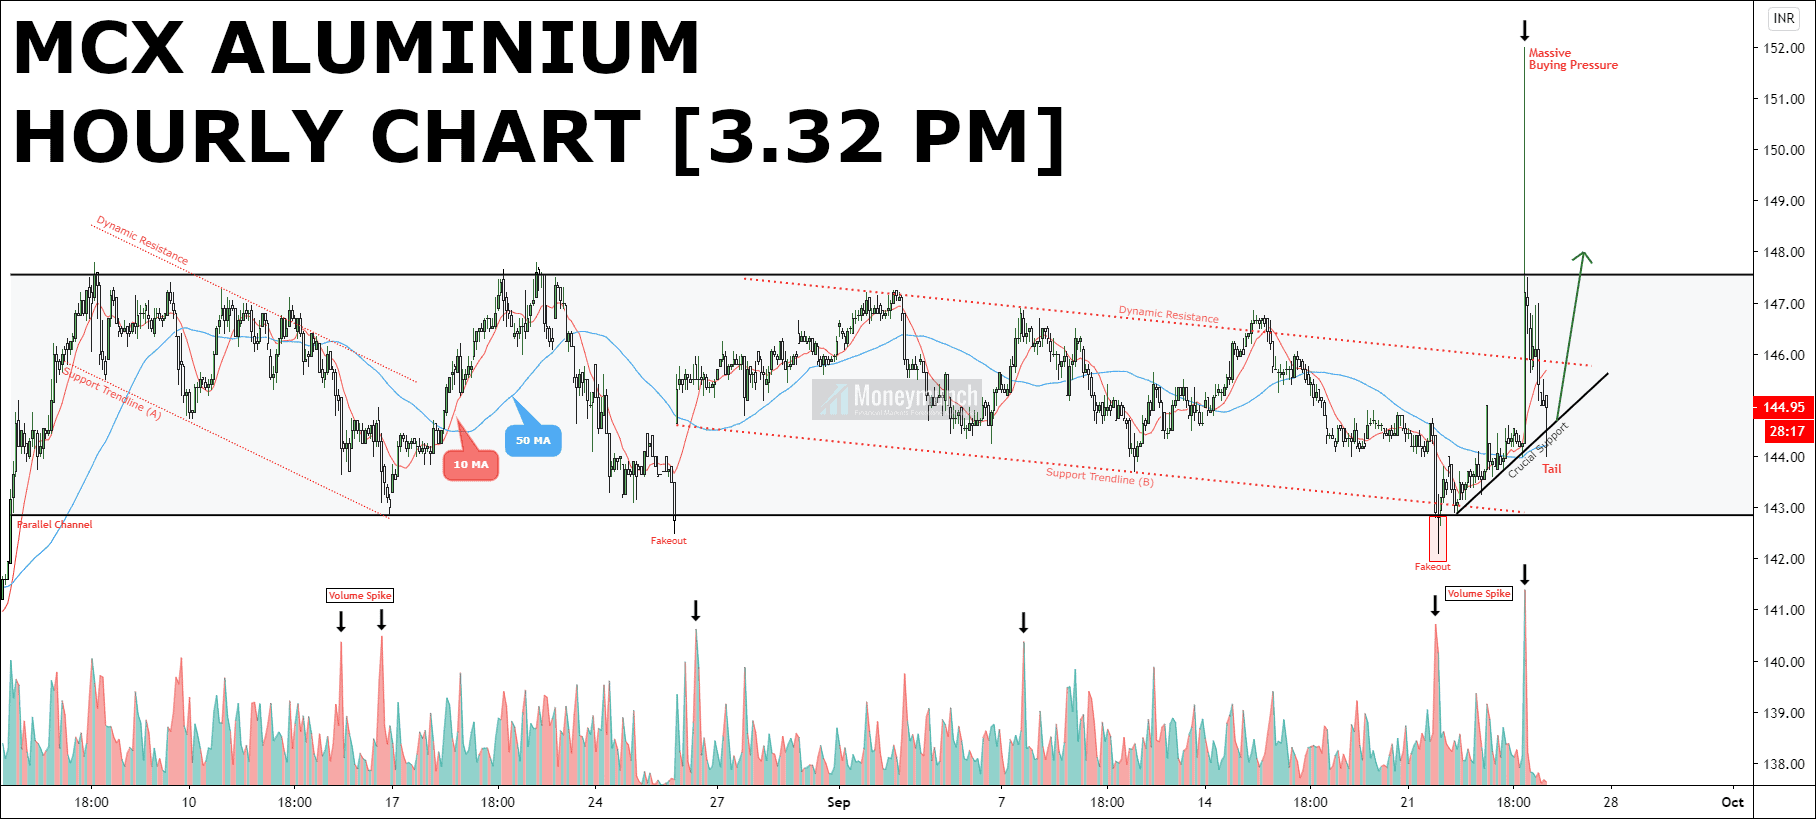
According to this chart, aluminium is moving flat under the rectangle pattern. The top of this rectangle is the resistance, and the bottom of this rectangle is the support. The trend is making frequent parallel channels between the support and resistance of this rectangle.

At present, aluminium is playing into support trendline (B). There is a crucial support. Fakeout, volume spike, massive buying pressure, and S-RSI crossover is made in that area.

So, break out of the crucial support means downfall for the levels of 143.6 – 142.6.

…but aluminium will try to climb because of 50 & 10 MA crossover. Therefore we may see prices at 146.6 – 147.4 – 148+ soon.

To become a subscriber, subscribe to our free newsletter services. Our service is free for all.

Continue reading
Gold, Silver, Natural Gas Trading Calls & Updates

Update: Is Gold Price Setting Up for an Uptrend?

Have you read the August 16th newsletter of Gold?
If not, click here.

I have written, “Don’t forget to follow the control price (CP). If gold breakdown CP, it may fall for 51360 – 51000 – 50500 – 50000 levels. Watch out the selling level on the chart.”

Yesterday gold has touched all targets. To become a subscriber, subscribe to our free newsletter services. Our service is free for all.

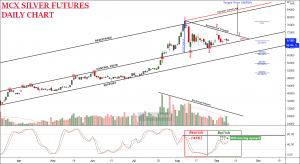
Is silver ready for the second target?

free commodity silver chart tipsDid you read the September 9th article of Silver?
Click here to read now

I have written in bold words, “…if you look at the volume and S RSI indicators, it is planning for a downtrend. And at present, silver is very close to the control price line. Hence, a downtrend may start from this point. A breakdown of control price can initiate a new fall for 61000 – 55785 – 50570 levels.”.

So, yesterday silver has touched the first target. If it remains under the retracement level of 38.20%, we may see continue downfall.

If it remains under the 38.20% retracement level, it will keep falling for the next target.

Please note that silver playing at March 2020 uptrend channel (support). Hence, don’t sell above it, Because it will start to rise from there up to 23.60% (67445).

Update: Natural gas Struggling at Strong Support

free mcx naturalgas chart tips

Have you read the natural gas intraday tips report?
Click here to read it now

I have written, “for safe traders, short positions can be initiated after 170 levels.
Targets: 167.6 – 165 – 162.6 – 160“.

Natural gas has touched all targets as well. What else you want?

The next report about MCX base metals commodities (Aluminum, Copper, & Nickel) is coming soon. Stay connected!

Continue reading

Natural gas Struggling at Strong Support

free mcx naturalgas chart tips
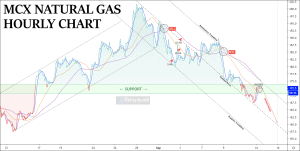
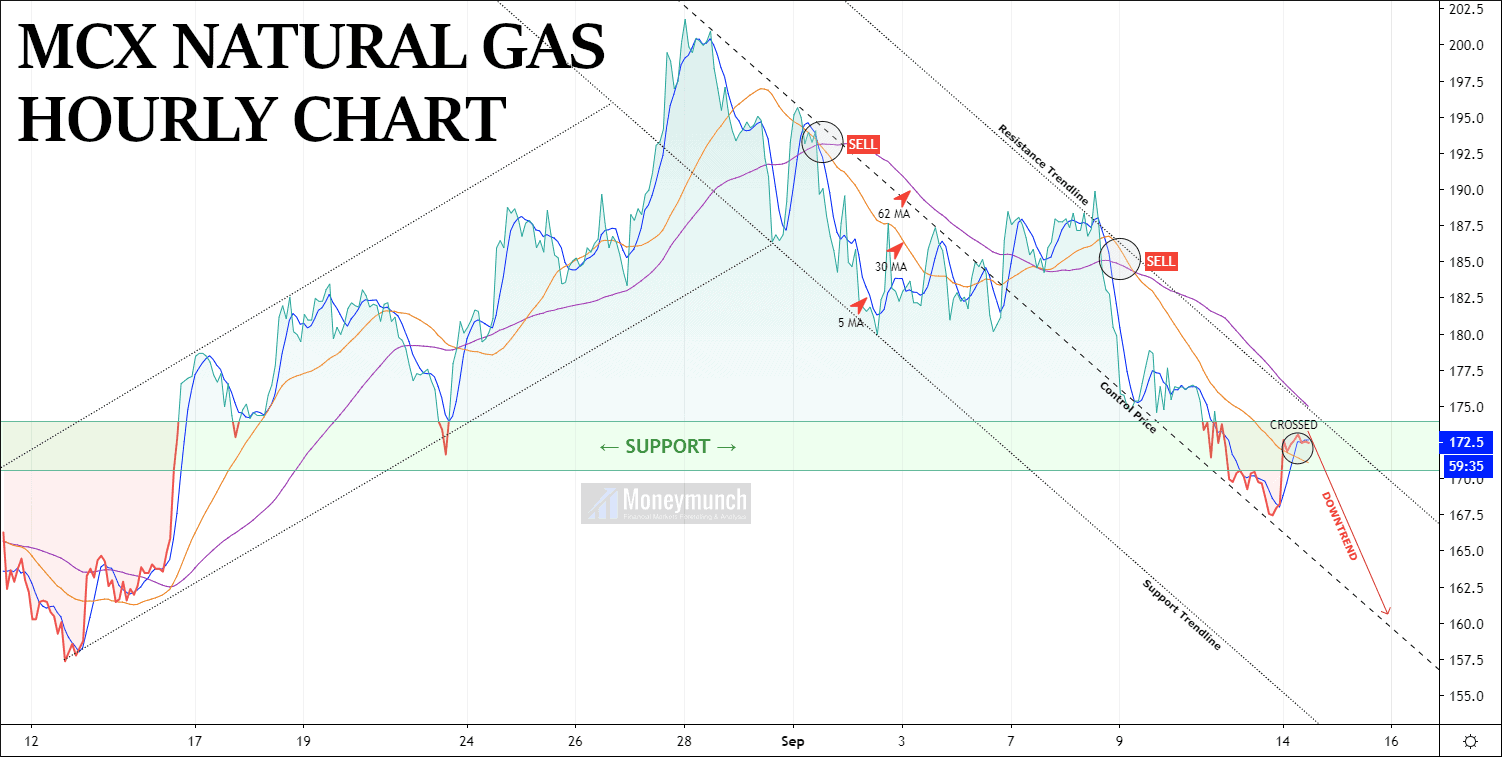
On the chart above, we have plotted three different MAs on the 1-hour chart of Natural gas futures. As you can see, the 62 MA is indicating a downtrend ahead. And 5 MA & 30 MA are crossing each other for a reversal. This reversal can be for 174 to 180 levels.

But according to the support & resistance trend line, we may see continue price collapsing.

I have also highlighted a support area with green color. Particularly, from this point, it’s taking a U-turn.

For safe traders, short positions can be initiated after 170 levels.
Targets: 167.6 – 165 – 162.6 – 160

To become a subscriber, subscribe to our free newsletter services. Our service is free for all.

Continue reading