
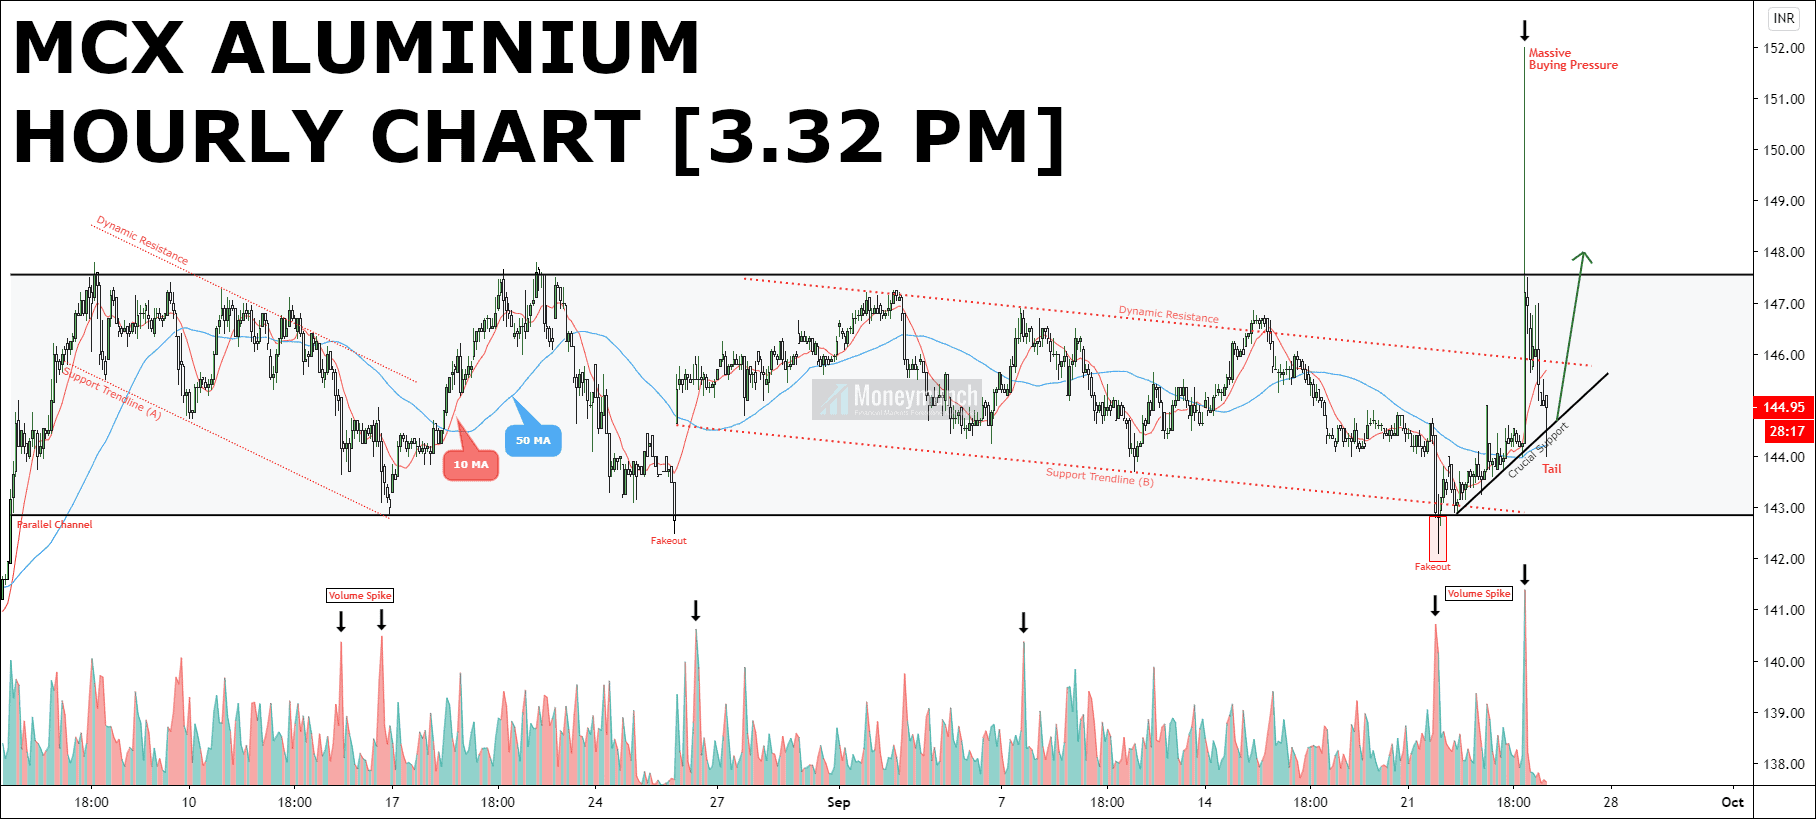
According to this chart, aluminium is moving flat under the rectangle pattern. The top of this rectangle is the resistance, and the bottom of this rectangle is the support. The trend is making frequent parallel channels between the support and resistance of this rectangle.
At present, aluminium is playing into support trendline (B). There is a crucial support. Fakeout, volume spike, massive buying pressure, and S-RSI crossover is made in that area.
So, break out of the crucial support means downfall for the levels of 143.6 – 142.6.
…but aluminium will try to climb because of 50 & 10 MA crossover. Therefore we may see prices at 146.6 – 147.4 – 148+ soon.
To become a subscriber, subscribe to our free newsletter services. Our service is free for all.
Get free MCX ideas, chart setups, and analysis for the upcoming session: Commodity Tips →
Have you any questions/feedback about this article? Please leave your queries in the comment box for answers.