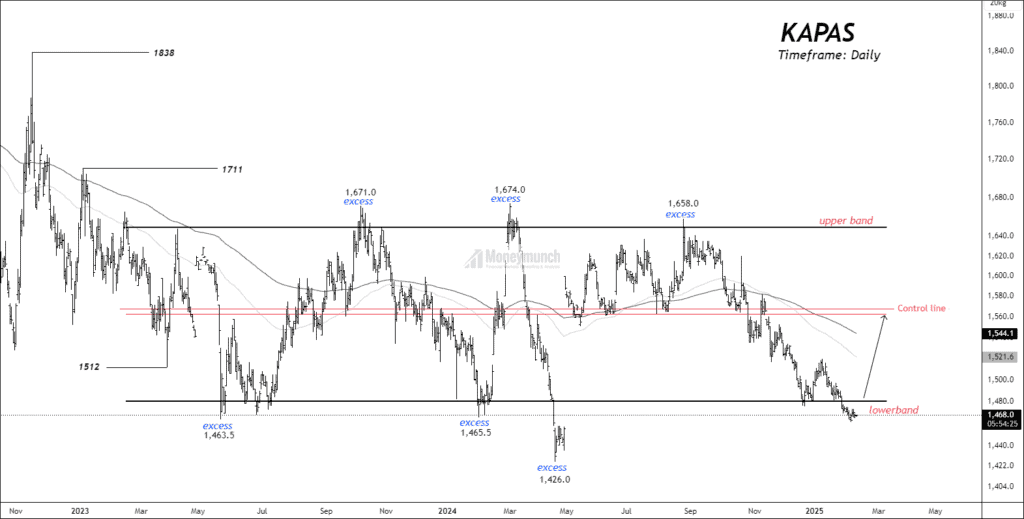

Timeframe: Daily
NCDEX KAPAS has been consolidating within a sideways value area for over 24 months. The price currently trades below both the 200 EMA and 100 EMA. The Average True Range (ATR) readings stand at 8.8 and 32.38. The price fluctuates within a strong range of 1650 to 1480. There are three excesses observed on both the upper and lower bands, indicating potential reversal zones. The current price action suggests the possibility of forming a new excess. Additionally, the control line has been tested by the price a total of 10 times, highlighting its significance as a key level.
 Unlock This Article
Get free important share market ideas on stocks & nifty tips chart setups, analysis for the upcoming session, and more by joining the below link: Stock Tips
Have you any questions/feedback about this article? Please leave your queries in the comment box for answers.
Great insights on KAPAS, very helpful
Interesting analysis, looking forward to more
Good to know about the price range. Keep it up!
Insightful post on the current trends