MCX SILVER – Strong Bullish Grip
Did you catch the MCX Silver wave setup in action?
Visit here: MCX Silver Ready to Launch Final Leg Up

Enhance your knowledge and trading skills with our FREE daily NCDEX agri commodity trading tips and research reports, covering a range of agri commodities in the commodity market.
Did you catch the MCX Silver wave setup in action?
Visit here: MCX Silver Ready to Launch Final Leg Up
Did you trade the NSE COCUDAKL wave setup?
Click here: NCDEX COCUDAKL: Wave 5 Rally Set to Extend Toward 3415+
 BEFORE
We had written clearly, “If the current momentum sustains and price breaks above 3,243 convincingly, the next leg higher could aim for projected resistance levels at 3302 – 3368 – 3415.”
 AFTER
AFTER
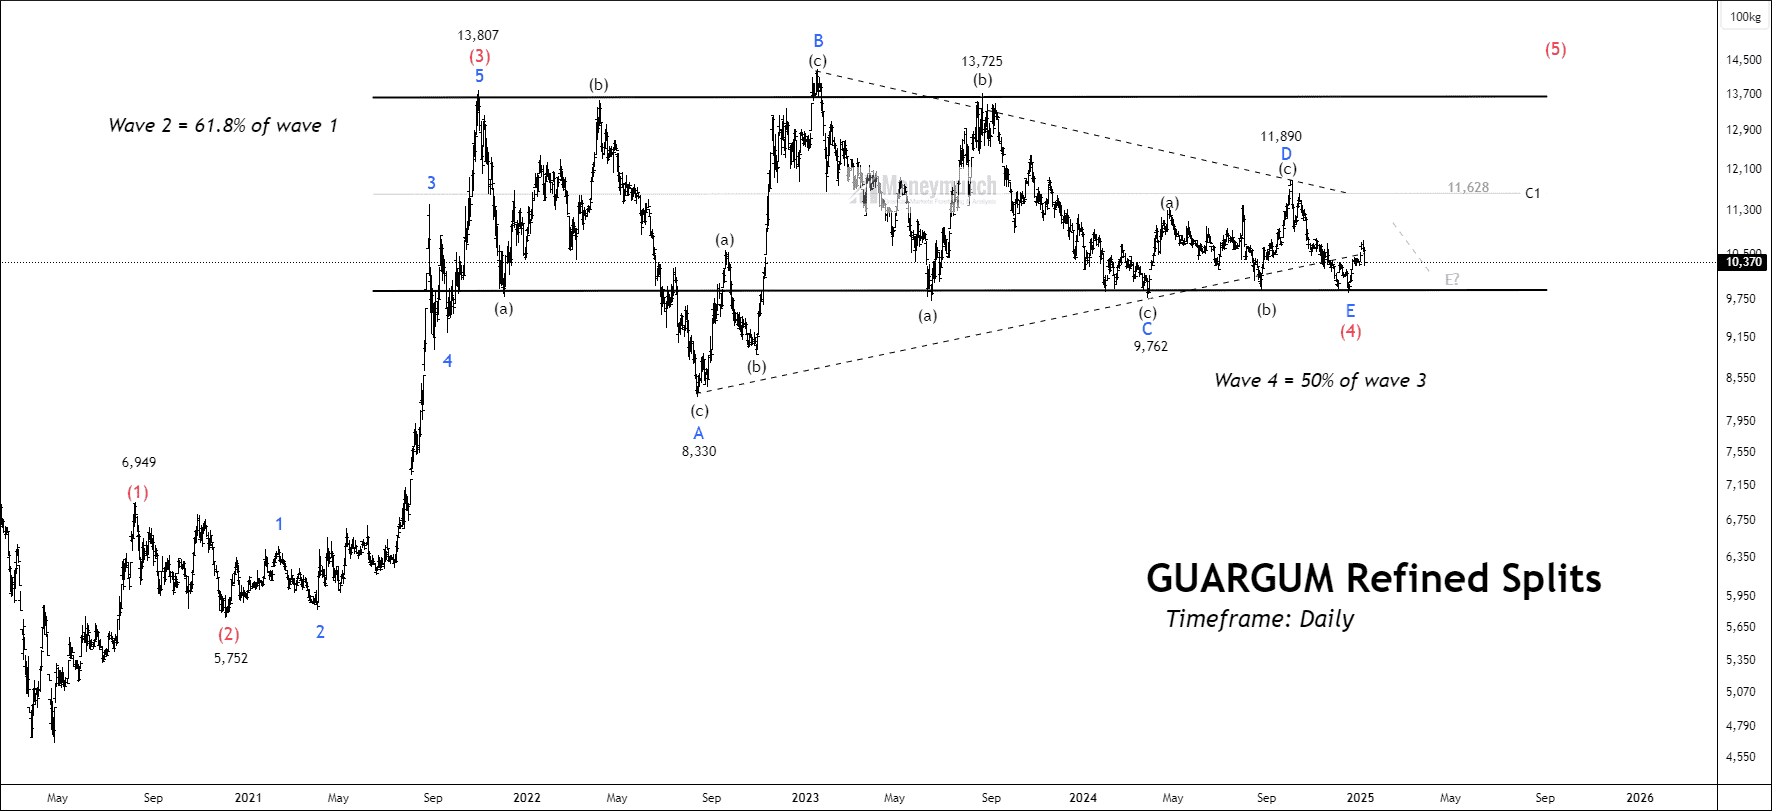
On the NCDEX, guar gum has formed an Elliott Wave cycle, with the final Wave E of Wave (4) approaching completion. A confirmation above Wave D could shift the entire outlook in favor of buyers. From a price action perspective, 9830 serves as a strong support level, while 13,650 acts as a supply zone, both of which have remained significant for over four years. Wave D represents a critical midpoint, ensuring a push toward the upper supply zone once the price sustains above this level or Wave D.
If the price has completed Wave (4) and has broken above Wave D, it is likely to reach the upper boundary of the value area, around 13,650. However, with the ADX (Average Directional Index) at 17, this suggests a weak trend, indicating that the current price movement lacks strength. If the price closes below the demand zone at 9,830, it could delay the expected bullish move. Traders should wait for confirmation before entering a long position to ensure a stronger trend.
We will update further information soon.
 Continue reading