Timeframe: Daily
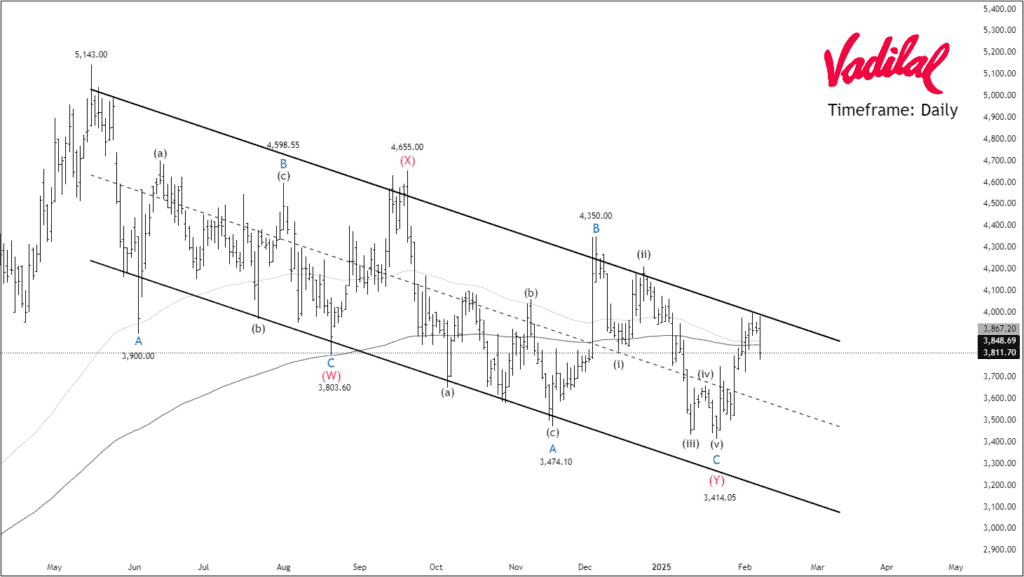
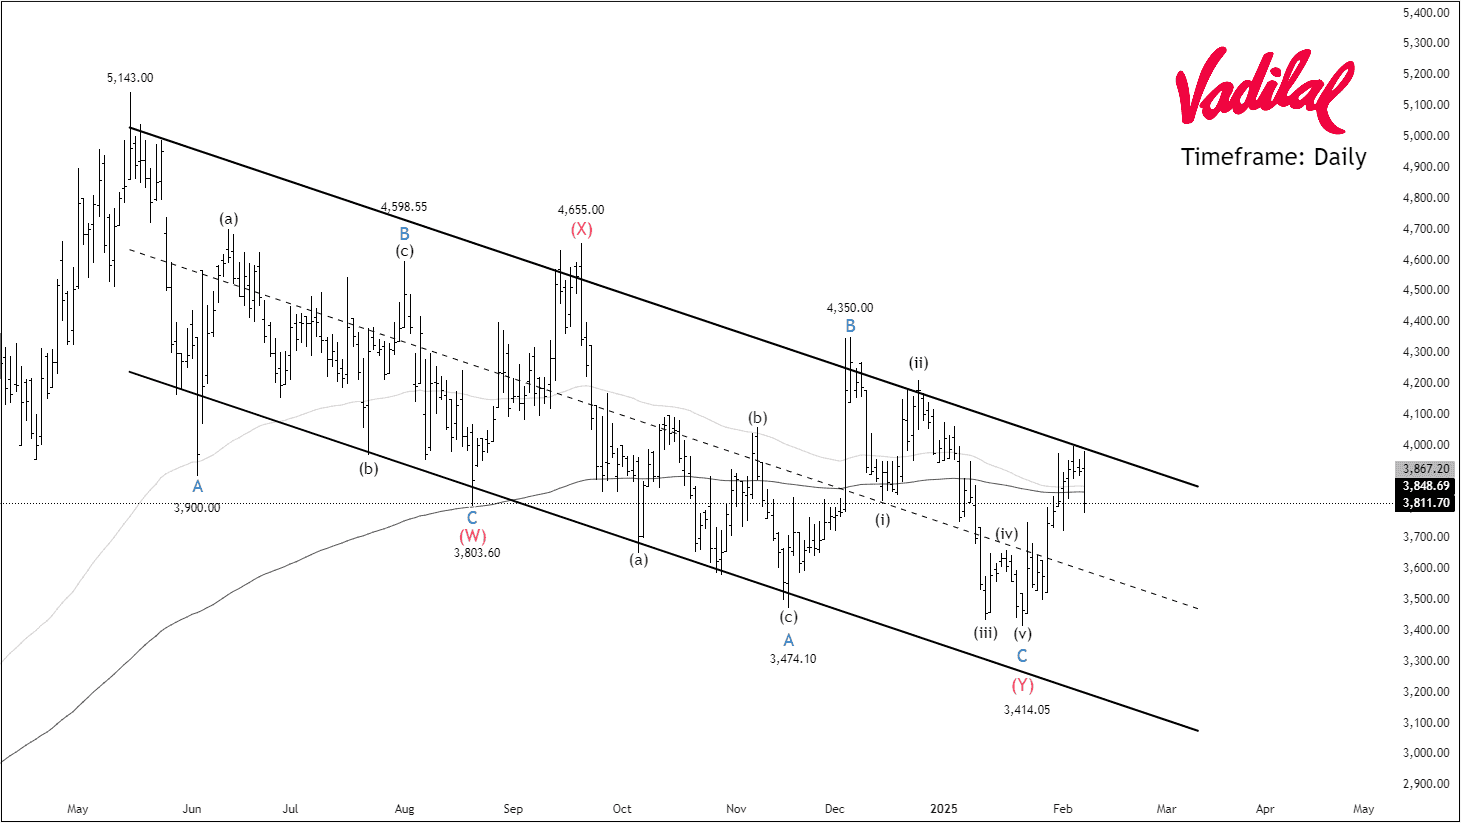
NSE VADILALIND has been trading within a downward channel for over 38 weeks. After reaching a high of ₹5143, the price declined by 33%. Currently, the price is facing resistance at the 100/200 EMA levels. The Average True Range (ATR) stands at 145.89, indicating moderate volatility, while the Average Directional Index (ADX) is at 18.29, suggesting a weak trend.
According to Elliott Wave Theory, NSE VADILALIND has formed a complex correction. The price has completed the final wave (v) of wave c of wave (Y) and has begun to rise. If this upward move is impulsive, the price is likely to break out of the parallel channel and demonstrate strength. However, if the move is corrective, it could represent wave (X-2) of a Triple Three combination, potentially leading the price back to the lower band of the channel. If the price successfully breaks out of the channel and sustains the above wave (ii), conservative traders can consider trading the impulse with the following targets: ₹4350 – ₹4625 – ₹4857+.
We will update further information for premium subscribers soon.
 Unlock This Article
Get free important share market ideas on stocks & nifty tips chart setups, analysis for the upcoming session, and more by joining the below link: Stock Tips
Have you any questions/feedback about this article? Please leave your queries in the comment box for answers.
Great work! Thanks for sharing.
Hey, I love how clearly you explained the implications of an impulsive vs. corrective move. Very helpful!
Clear, concise, and very informative