First, we’re going to do a review of the wave principle if you are new or beginners. The wave principle is a form of technical analysis that is based on crowd psychology and pattern recognition. What the wave principle does is provide the context of you and it does so by means of two different modes.
- Motive waves and,
- Corrective waves
Within the Motive wave family we have two types: impulse wave and diagonal. For the Corrective wave family we have 3 types: Zigzag, Flat and Triangle.
Let’s first examine what an impulse wave looks like.

This is what a classic or standard “Elliott Wave” impulse wave real-time example in above chart. It is a 5 wave non-overlapping move waves 1,2,3,4 and 5. Therefore, those who have some experience with the wave principle will recognize the “wave 3” as an extended wave. Here, within this move to the upside, this impulse wave. The reason it’s so important is that it defines the trend of the next launcher degree, therefore this could be either “wave (1)” or “wave (B)”.
Now there’s some rules that pertain to the structure.

Rule 1) is that wave 2 never retrace more than 100% of wave 1, meaning it cannot fall below this extreme starting point of wave 1.
Rule 2) is, wave 3 never be the shortest impulse wave. It doesn’t necessarily have to be the longest but it can never be the shortest.
Rule 3) of an impulse wave is that wave 4 never ends in the price territory of wave 1 because it’s a rule violation and thus it’s not an impulse wave.

AxisBank weekly price chart under the corrective phase. The price 784 already tested of retracement 61% for wave ((b)), of wave ((a)). I’m looking at the Price Action candle as a turning point as evidence.
In this Axis Bank price chart, the “Motive phase” has been unfolded clearly with 1,2,3,4 and 5 by respect of all Elliott wave rules. There are two possibilities at higher degree either wave (1) or (B) but, wave (B) can not have 5 subwaves therefore, we can say this is the wave (1) because of 5 waves evidence. Let’s assume forward that the wave (1) red is at higher degree therefore, now the price will follow ABC correction for corrective phase which can be one of 3 patterns, flat, zigzag and triangle. In other words, the price is going to print wave (2).
Before looking into 3-corrective patterns(flat, zigzag and triangle) one by one, we will shift the lower timeframe as Daily.

For the zigzag pattern (5-3-5), the sub-wave ((b)) can not overlap the origin of the wave ((a)). If this is sharp zigzag, then price will not move beyond the .786(821). The price is already at or near .618(784) fib. ratio.

For Flat pattern (3-3-5), looking for pullback for wave (B) and then next can be (C) up-ward of wave ((b)).
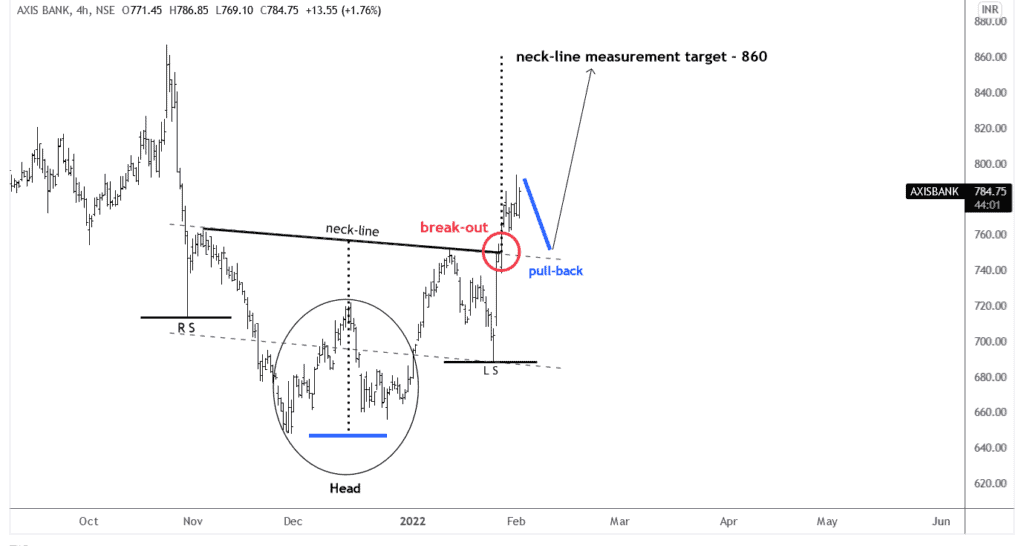
“Head and Shoulders” pattern.

I do like the head and shoulders pattern and the reason why I like the head and shoulders pattern is just because it’s easily discernible on a price chart, and offers a number of good parameters to actually trade. It was actually popularized by Edward,and Magee in their book “technical analysis of stock trends” and essentially consists of a left shoulder ahead in a right shoulder. And then what you do is the little intervening low between the left shoulder and head. That would be right here.
Let me go ahead and identify and neckline measurement. It’s important to understand with respect to “Neckline Measurement” that in neckline measurement represents the minimum objective of the pattern and that simply.The distance between the head and the neckline. Again, this trend line right here projected up-ward from the breakdown point. The neck-line from head distance came actual 100 points over. From the break-out point, we can expected 100 points up move.
Head & Shoulders Pattern on Weekly price chart:

Brief Summarized:-
Weekly Trend: Corrective pattern (downward trend) – long term support 38.2% at 645 & 61.8% at 508 but the price has not started for this track.
Daily Trend:
- continuing up-trend and possible stop 820 nearby for target downward – ZigZag pattern
- up-trend can continue after one pullback – Flat pattern
4 hours Time-Frame:
After a little pullback at neck-line, the price can push upto 850 – H & S pattern.
To become a subscriber, subscribe to our free newsletter services. Our service is free for all.
Get free important share market ideas on stocks & nifty tips chart setups, analysis for the upcoming session, and more by joining the below link: Stock Tips
Have you any questions/feedback about this article? Please leave your queries in the comment box for answers.