

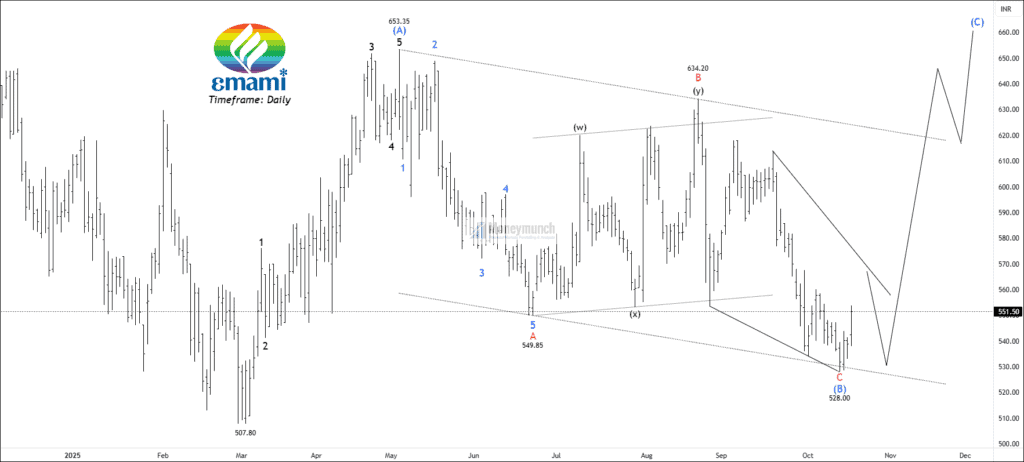

NSE EMAMILTD – Elliott Wave Projection
NSE EMAMILTD shows a clear Elliott Wave structure in progress. Wave (A) completed around 653, followed by a complex corrective phase as Wave (B) that ended near 528. This correction unfolded in a W–X–Y pattern, showing a mix of sideways and downward moves. The recent bounce from the 528 level suggests the start of Wave (C), which could push prices higher toward the 620-660 zone if momentum continues. Overall, the structure looks like the end of a correction and the possible beginning of a new impulsive upward leg. Targets for this setup are 608 – 634 – 653+.
NSE BHARTIHEXA – Positive Momentum Building Above 1780
The price has broken out above the horizontal resistance trendline. Before the breakout, the stock was trading in a tight range, showing strength and very little selling pressure. The price is trading above the 50, 100, and 200 EMAs. Strong support is visible near 1,735. Increasing green volume bars validate buying interest and institutional participation.
If price sustains above 1780, traders can trade for the following targets: 1819 – 1852 – 1887+.
 Unlock This Article
NSE RADICO – Bulls Gaining Control
The stock is moving near a strong resistance zone after a steady uptrend. It has tested this level multiple times, and now it’s showing signs of a possible breakout. The price action looks positive, and the candles are forming higher highs with good strength. The MACD indicator also shows a bullish crossover, confirming that momentum is shifting in favor of the bulls.
If the price sustains above 3,060, traders can buy for the following targets: 3122 – 3185 – 3251+.
NSE SBFC: Symmetrical Triangle Breakout on the Cards
NSE SBFC is forming a symmetrical triangle pattern, showing price compression before a possible breakout. Price is moving near the resistance line, hinting at a breakout zone formation. The “volume spurt” confirms growing market interest at this level. MACD shows a bullish line crossover, signaling upward momentum. A strong green candle with high volume suggests buyers are stepping in.
If the price sustains above 110.5, traders can buy for the following targets: 113.7 – 117.8 – 119.7+. Free subscribers can take previous day’s low as invalidation level.
LAURUSLAB FUT – Premium Setup
EMAMILTD – High Confidence Setup
Get free important share market ideas on stocks & nifty tips chart setups, analysis for the upcoming session, and more by joining the below link: Stock Tips
Have you any questions/feedback about this article? Please leave your queries in the comment box for answers.

Please share the latest view of banknifty. Your previous call was very much profitable.
sir please enlighten us with your new investment idea regularly. we keep waiting