

UTIAMC – Wave (5) Breakout Setup Looks Promising

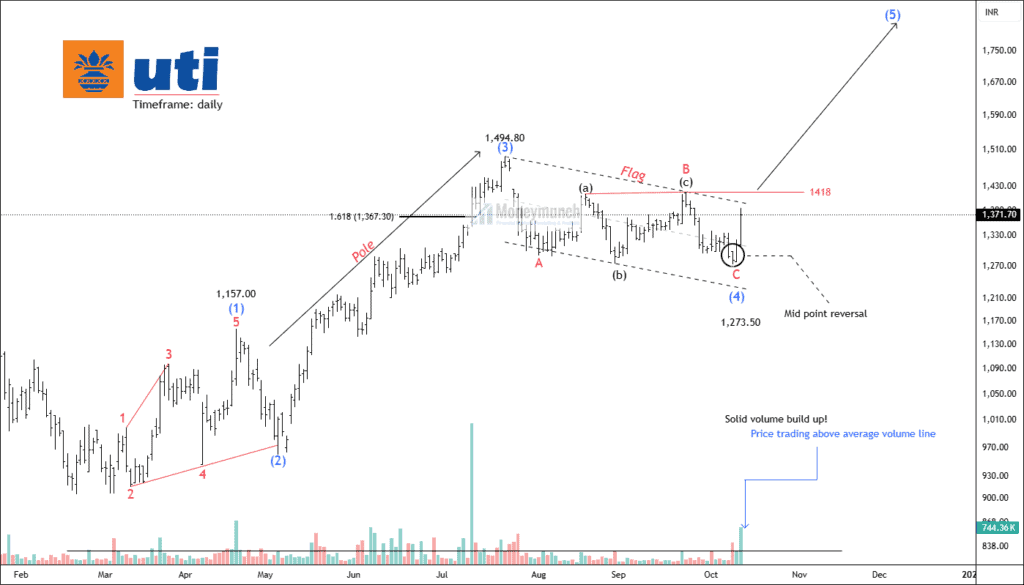
UTIAMC has shown a healthy correction after completing a strong impulsive rally. The stock formed a clear flag pattern following the top near 1,494.8, which marked the end of wave (3). The corrective phase unfolded in a classic A-B-C structure, where wave C ended around 1,273.50, which also coincides with the mid-point of the previous advance.
Recently, the price reversed sharply from this support zone with a noticeable rise in volumes. This solid volume build-up indicates fresh accumulation and a potential end to the correction phase. The stock is now trading above the average volume line, a positive sign for momentum traders.
The immediate resistance is around 1,418, which marks the upper boundary of the flag pattern. A strong breakout and sustained move above this level would indicate the beginning of wave (5), suggesting the next major upward move in price.
If this breakout happens with strong volume, the stock has the potential to rally towards 1497 – 1,540 – 1,645, based on the 1.618 Fibonacci projection. Overall, the price structure, wave count, and volume behavior all point to a bullish continuation in the coming weeks.
 Unlock This Article
NSE ADANIPORTS FUT – Premium Setup
Get free important share market ideas on stocks & nifty tips chart setups, analysis for the upcoming session, and more by joining the below link: Stock Tips
Have you any questions/feedback about this article? Please leave your queries in the comment box for answers.

interesting, nice one
Gold bullish + stagnant oil = Tulips – seems like quite a reach.
Very weird global sentiments! Please analyze gold.
This Scenario is realistic, what about hdfclife and titan?