

BSE Near ATH: Breakout or Rejection?
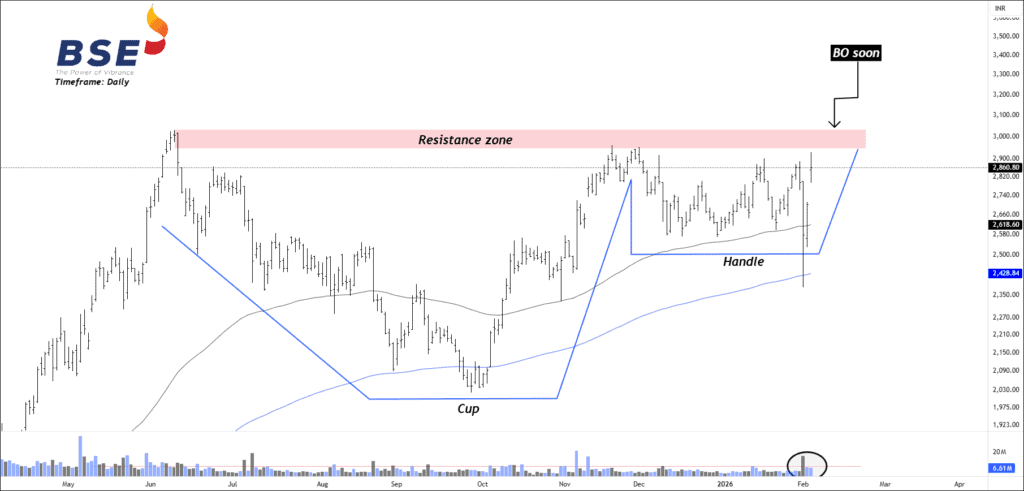
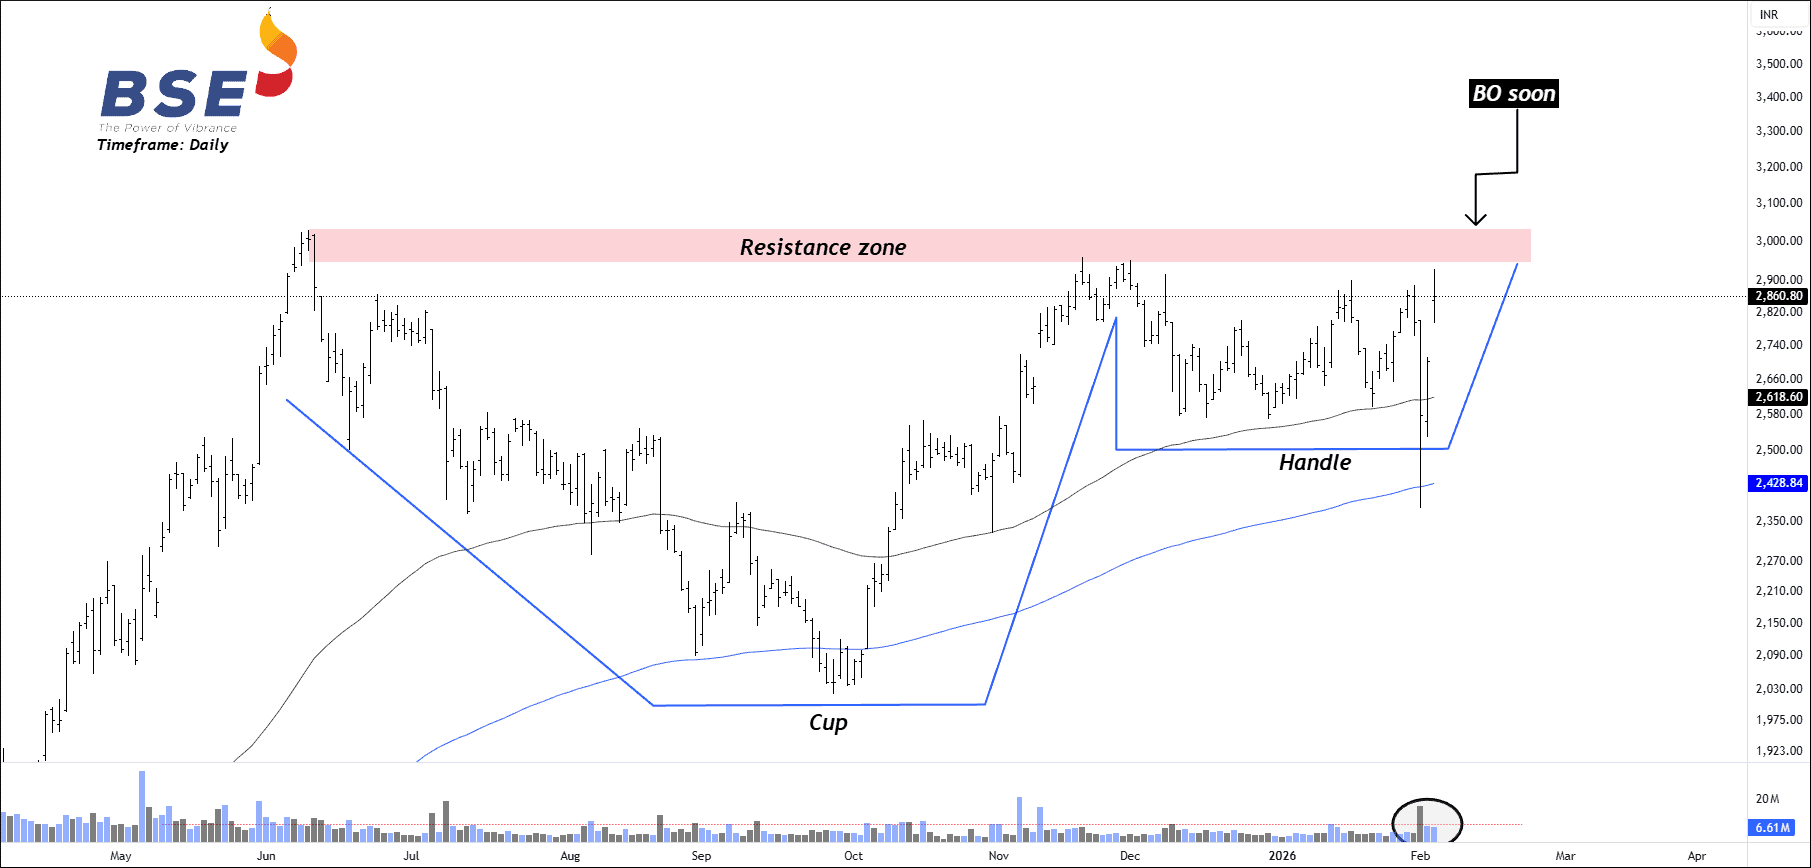
BSE is in a clear uptrend, and the recent sideways movement is a healthy consolidation. A cup & handle pattern is forming, which usually signals trend continuation. Price is now testing a strong resistance zone (previous highs). This level has rejected the price earlier, so it’s important. The positive signs are rising volume near resistance and a bullish EMA crossover, showing buyers are gaining control and dips are being bought. This increases the probability of a breakout.
If the price breaks out the neckline, traders can long for the following targets: 3200 – 3500 – 3800+. A new low below the handle support will invalidate the bullish setup.
We will update further information soon.
NSE TI – Make-or-Break Zone Around 440
NSE TI has successfully retested the previous resistance zone and held it as support, confirming a clear reversal of roles. The strong bounce from the 380 – 390 support area indicates renewed buying interest. The 420 – 450 zone now acts as a near-term reversal or supply area where price may react. A decisive move above 450, accompanied by increased volume, would strengthen the bullish outlook, while a break below support would weaken the structure.
If the price sustains above 440, traders can long for the following targets: 462 – 485 – 506+. Free subscribers can take the previous day’s low as an invalidation level.
 Unlock This Article
Get free important share market ideas on stocks & nifty tips chart setups, analysis for the upcoming session, and more by joining the below link: Stock Tips
Have you any questions/feedback about this article? Please leave your queries in the comment box for answers.
