

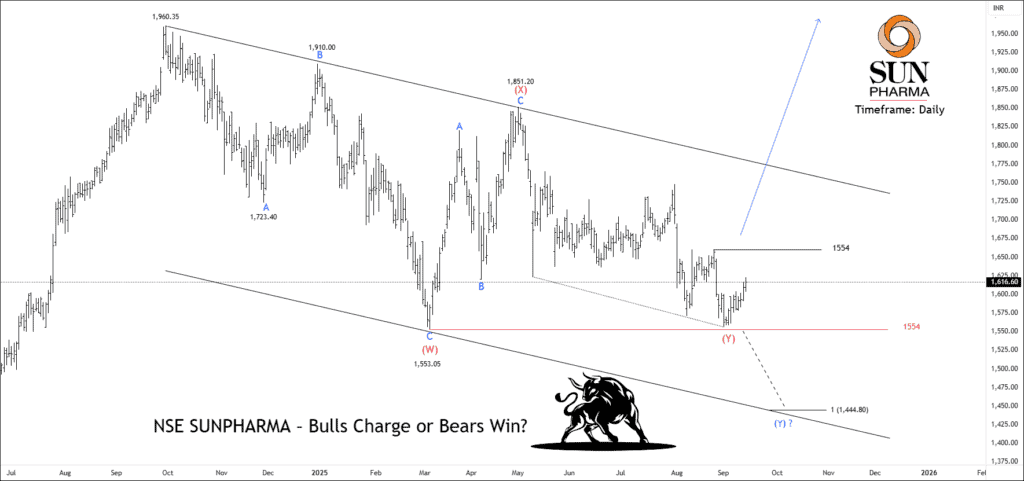

NSE SUNPHARMA – Bulls Charge or Bears Win?
Timeframe: Daily
After hitting 1,960.3, Sun Pharma entered a correction forming a W–X–Y pattern. Wave W ended at 1,553, wave X peaked at 1,851.2, and wave Y is still unfolding, marking the last leg of the correction. The stock’s ATR is 27.49 and ADX is 14.42, indicating moderate volatility with weak trend strength.
Price rebounded from 1,554, which matches the wave W low, suggesting wave (Y) might be finished or truncated. If so, a new impulsive rally could be starting, targeting 1746 – 1827 – 1920+. But if the correction isn’t over, one more drop toward 1505 – 1425 may complete wave (Y).
 Unlock This Article
NSE ICICIBANK FUT – Wave C Done, Rally Ahead
On the Daily chart, the price has completed wave C of the corrective pattern at 1392.4. The ATR is 14.58 and the ADX is 21.48, showing moderate volatility with improving trend strength. The price has also broken above the 100 EMA and is now trading above the 200 EMA, signaling bullish momentum.
NSE ICICIBANK is trading in a price range of 1416 – 1392. If the price sustains above 1414, traders initiate long for the following targets: 1428 – 1450 – 1465+. Free subscribers can take the previous day’s low as an invalidation level.
Premium subscribers will get trade setups with entry, exit, and invalidation levels on our mobile application.
Premium Content 🔒
Exclusive setups for NSE stocks AXISBANK FUT, CIPLA FUT, SUMICHEM and HFCL are available below. Please log in to view the details.
NSE AXISBANK FUT – Exclusive Setup
NSE CIPLA FUT – Premium Wave Setup
NSE SUMICHEM – High-Confidence Setup
NSE HFCL – Swing Setup
Get free important share market ideas on stocks & nifty tips chart setups, analysis for the upcoming session, and more by joining the below link: Stock Tips
Have you any questions/feedback about this article? Please leave your queries in the comment box for answers.

Please update your views on Nifty and Banknifty
Axis ka first target hit hogaya
i also agree – slow but strong buying already going on