

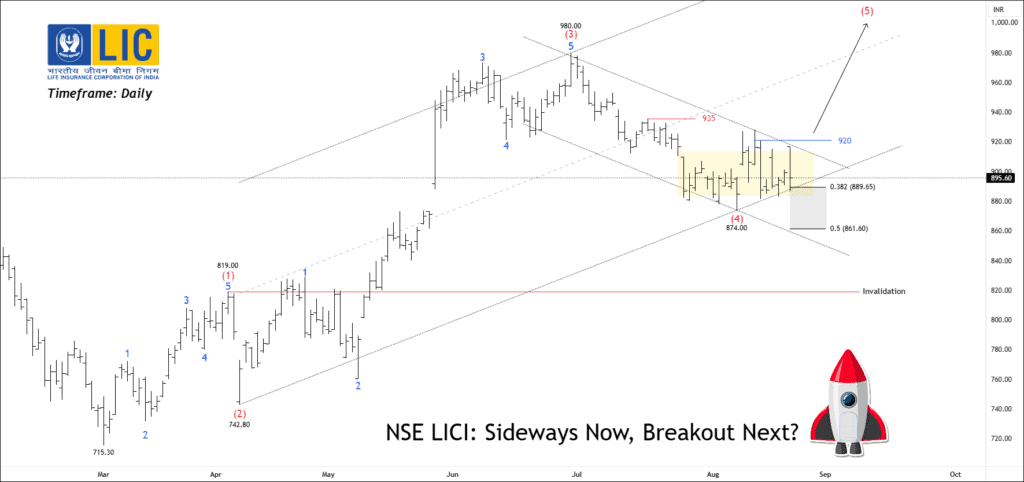
NSE LICI: Sideways Now, Breakout Next?

Timeframe: Daily
NSE LICI has initiated an impulsive cycle from the low of 715. The third wave peaked at 980, and then the price corrected down to around 874, which fits well with the normal Fibonacci retracement levels. The price is currently trading above key levels, with an ATR of 19.66 and an ADX of 19.68, indicating moderate strength. However, the price is facing strong resistance around the 50/100/200 EMA levels.
At a glance, the stock is moving sideways between 874 support and 920–935 resistance, showing that it is in the preparation stage before the next big move. If the price breaks and holds above 920, it can start the final Wave 5 rally, which may push the stock towards 935 – 964 – 1025+. On the other hand, if it falls below 874, the stock may spend more time consolidating before continuing its upward journey.
Premium subscribers will receive a trade setup with exact entry, exit, and invalidation levels on our mobile application.
BANKNIFTY FUT: Price Action Outlook
BANKNIFTY FUT is currently moving in a sideways phase, trading within the range of 55,600–56,000. The price is consolidating in this zone after recent swings, with buyers defending the 55,600 support and sellers capping the upside near 56,000–56,226. This tight consolidation suggests that the index is waiting for a breakout before making its next directional move.
If Bank Nifty breaks above 56,000, it could trigger fresh buying momentum, pushing prices towards 56,400 – 56,600 – 56,925+. On the other hand, a breakdown below 55,690 may invite selling pressure, leading the index lower towards 55,300 – 55,000 – 54,800. Until then, traders can expect sideways movement within this defined range and may benefit from low-risk intraday setups.
We will update further information for premium members soon.
NSE DRREDDY FUT – Elliott Wave Setup
Timeframe: Daily
NSE DRREDDY has given a strong breakout above the 20/50/100/200 EMA band, showing fresh strength in the trend. The ATR is at 24.48, reflecting decent price movement, while the ADX at 18.40 indicates that the trend is still in its early stage and gaining momentum.
According to the wave principle, it seems the price completed its corrective move at 1183 and has now started an upward impulsive trend. Wave 4 formed around 1234.5, and the price is now moving up in the final Wave 5. If the price breaks above 1259, traders can consider buying for targets at 1282 – 1302 – 1330+. Free subscribers can take the previous day’s low as an invalidation level.
We will update with further information for premium members soon.
Get free important share market ideas on stocks & nifty tips chart setups, analysis for the upcoming session, and more by joining the below link: Stock Tips
Have you any questions/feedback about this article? Please leave your queries in the comment box for answers.

I dont think banknifty’s target will reach. Your theory is not sufficient to predict the move of the index. best of luck.
Banknifty has already done all the targets.
Excellent analysis!
Clean and clear setup.
Guru sir,
I’ve made a payment of 38999 using my BHIM UPI to your UPI ID for stock market plan. What do I do next? My transaction ID is 205102537325.
Rupaalkumar from Kodaikanal
Thank you for your payment of ₹38,999 via BHIM UPI. We have sent a welcome email to your registered email ID containing your login details, full access information, and activation instructions. Please check your inbox (and spam/junk folder if needed).
Welcome to Moneymunch! 🚀
Gold ke bare me kuchh batao
Nifty me kya lagraha he wo bhi updte dena