S&P 500, Inverse “Head and Shoulders” Pattern Continues to Play Out as Heavy Week of Economic Data Begins

The first week of the month is always the most interesting, with global purchasing managers indexes, U.S. ISM’s, and employment data released.  Overnight we see continued weakness in Europe’s economic data and perhaps some more “green shoots” in China.   Europe is sporting “beige shoots” at it is reaching the stage where things are so bad it is difficult to go down further.

  • Euro-zone manufacturing activity contracted for the ninth consecutive month in November, albeit at a slower pace than in October. Markit’s Eurozone manufacturing Purchasing Managers Index (PMI) rose to 46.2 in November from October’s 45.4, though it stayed below the 50 mark dividing growth from contraction for the 16th straight month.
  • The new export orders index was revised up to 46.4 from the preliminary reading of 45.9 two weeks ago, and it now reads more than a full point higher than the October reading.
  • Manufacturing accounts for around a quarter of the euro zone’s private economy and is dwarfed by a services sector that fared badly in November, the data two weeks ago showed.

China seems to be “recovering” not due to the private sector, but government led:

  • The final reading for the HSBC Purchasing Managers’ Survey (PMI) rose to 50.5 in November from 49.5 in October, in line with a preliminary survey published late last month. It was the first time since October 2011 that the survey crossed above 50 points, the line that demarcates accelerating from slowing growth.
  • An official PMI survey of China’s non-manufacturing sectors also ticked up, to 55.6 in November from 55.5 in October, led by expanded activity in construction services. But growth in air and rail transport and food and beverages both slowed.
  • Growth accelerated for large firms for the third month in a row, but medium and smaller companies saw a retrenchment, with the decline more pronounced for the smaller firms, the NBS said in a not accompanying its official manufacturing PMI survey. “The improving numbers are mostly because of government investment,” said Dong Xian’an, economist with Peking First Advisory, referring to the official PMI.

As for the U.S. we have ISM Manufacturing this morning at 10 AM; consensus for 51.7 – flat with last month.  Construction spending also hits at 10 AM – expectation 0.4% growth.

Wednesday ADP employment which hopefully with some recent changes is “somewhat” closer to government data on a month-to-month data (before revisions) – expectations of 125K versus 158K.  Sandy should be an issue.  ISM Non Manufacturing, expectations of a drop to 53.6 versus 54.2.

Friday is the much watched (Jack Welch) employment report – expectations of only 80K versus last month’s 171K, again Sandy impacts here.  Unemployment rate expected up to 8.0% versus 7.9%.


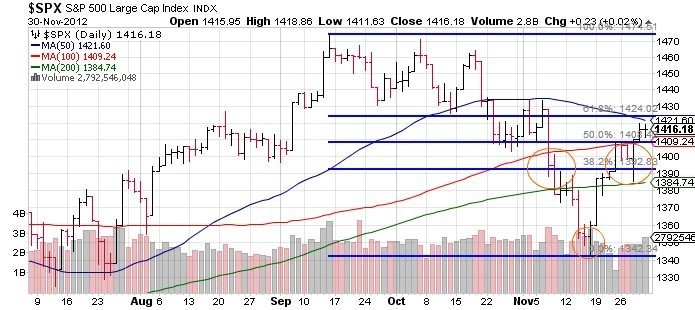
As for the technical picture, we have a gap up this morning on any myriad of “positive” news items – China PMI (despite China stock market falling yet again), European PMI not getting worse (European markets acting WELL), or Spain asking for bailout funds for its banks (no surprise, but algos read the headline and futures popped).  Evidence continues to mount for a continuation of an inverse “head and shoulders” bottom move; if this continues there should be a move to the mid 143os to upper 1440s (depending on what you use for the head and neckline – up for some interpretation).   Now if that happens this would create the first “higher high” in the S&P 500 since the correction began in mid-September, but if that is all the move has in it would be a particularly nasty spot to reverse since everyone would say “a new high” and the trend is changed.   But we’ll see – this market has become famous since 2009 for “V shaped” moves that continue in one direction (not the boy band) without relent so the talk of “performance chasing” and “underinvested longs” and “repeatedly scarred shorts” should be relentless over S&P 1435.

At the time I write this the S&P 500 is gapping up to the 61.8% retrace of the entire two month correction.  As posted Friday, the ability for the market to move sideways to consolidate gains was a positive – so the corrections in this move up have come mostly via time rather than price.
sp-500-Head-and-Shoulders

Continue reading

S&P 500: Complicated from Here

While things are never easy, the (quote-unquote) obvious trade in the major indexes has now played out, especially on the S&P 500.  Of course most of it happened in an overnight gap up, but that has been par for the course.  From here things get more complicated.  Here are a few ways to look at the roadmap utilizing the S&P 500.

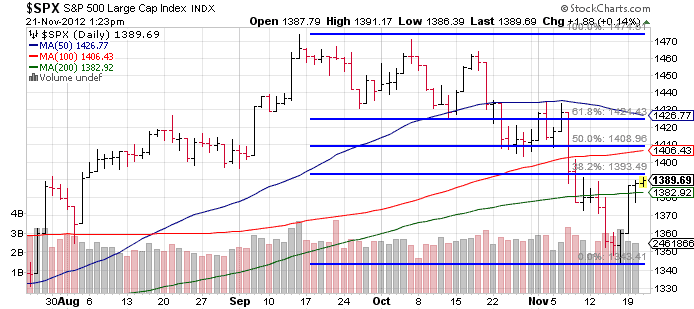
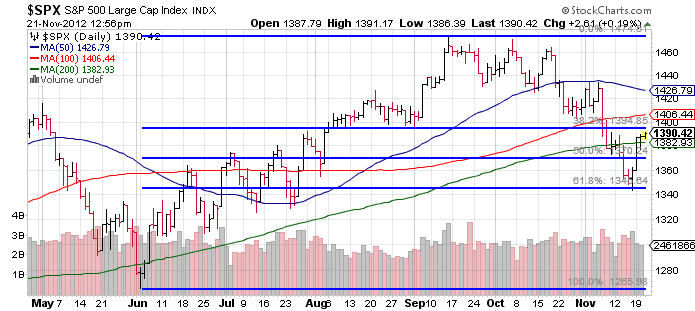
First the original S&P 500 chart that has been in play for months, looking at the June-Sep run, and pullback since.   Two key points here – the index has bounced from the 61.8% retrace to nearly the original 38.2% retrace at ~1395.   That number is also key in that it was support multiple times in August 2012.  Support turns into resistance and vice versa so this 1395 level is a very obvious level to watch.

s-and-p-500

Second, is the chart I posted yesterday morning which is simply the same Fibonacci levels but focused solely on the September-November pullback.  What’s the first number that sticks out?  1394 (call it 1395, close enough for government work).  That is the 38.2% retrace of the two month correction.

s-and-p-500-index

If 1395 is vanquished, the next two levels are 1409 to 1424 which you can see was an area with a lot of traffic in late October to early November before the correction became much more ferocious.   That second number also coincides with a falling 50 day moving average.

Last, on a very short term frame there is a potential for an inverse head and shoulders formation (which favors bulls) in the near term.  The head being Thursday/Friday’s lows and the neckline being about “here” at 1390.   If that does play out, it measures to a target of ~1430.  That would be a 3% move from here.. and still not create a new higher high versus those early November levels.  Hence all that could in theory happen and still bode poorly afterwards.   But either way, one can see all the congestion and push pull in the areas overhead.

Of course all this coincides with positive seasonality, the constant negotiations re: the fiscal cliff, the next round of easing to be announced at December’s FOMC meeting (to replace Operation Twist), and a slowing corporate earnings outlook.

Anyhow enjoy the Thanksgiving holiday and we’ll catch you on the other side.

Continue reading

ETF (GOLD & US Dollar)

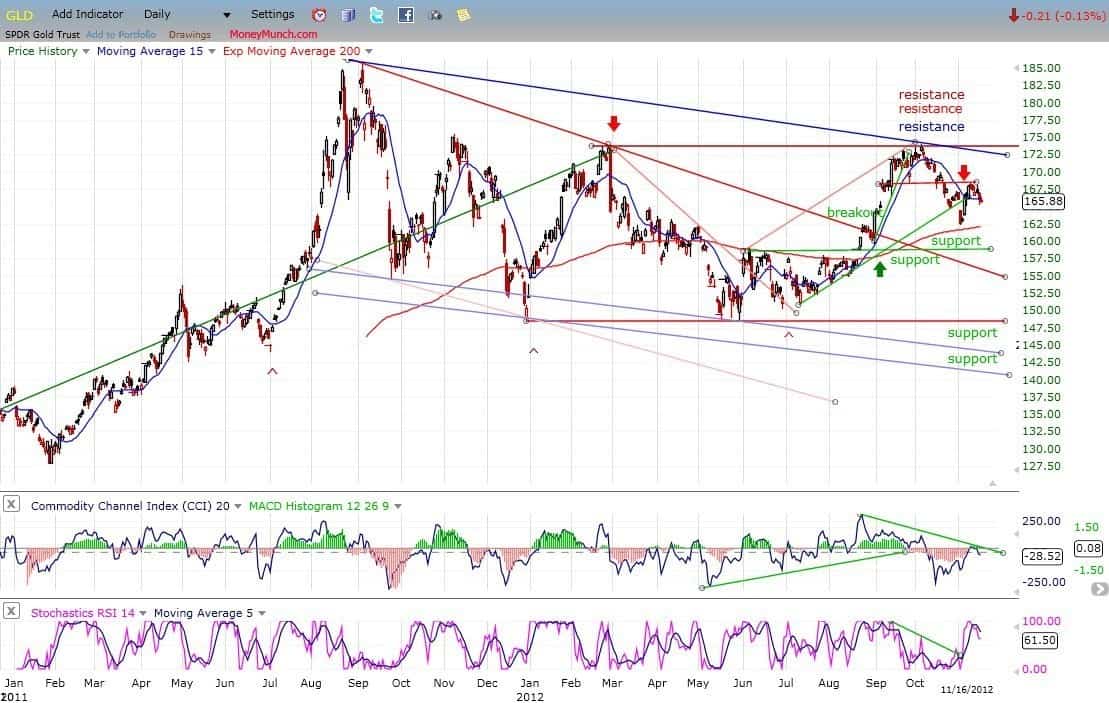
On its way down from 168, GLD broke its first support level and came to rest on the second (200-DMA) from which it had a bounce. Last week, I suggested that it might find some resistance on the small horizontal red trend line, which it has, and which caused it to pull back three points. It’s difficult to see how it could have much more of a decline right away if the market is going to have a mid-correction rally, so we can probably expect the near-term trend to turn up again, perhaps reaching the top channel line (blue) before rolling over again.

Gold Etf

If GLD does not have much of a rally from here – especially if the market does rally – it will be an indication that some decent weakness can be expected into the cycle low. In any case, subsequent action should form a P&F pattern which will help us determine the extent of the decline into the 25-wk cycle low.

UUP (dollar ETF)

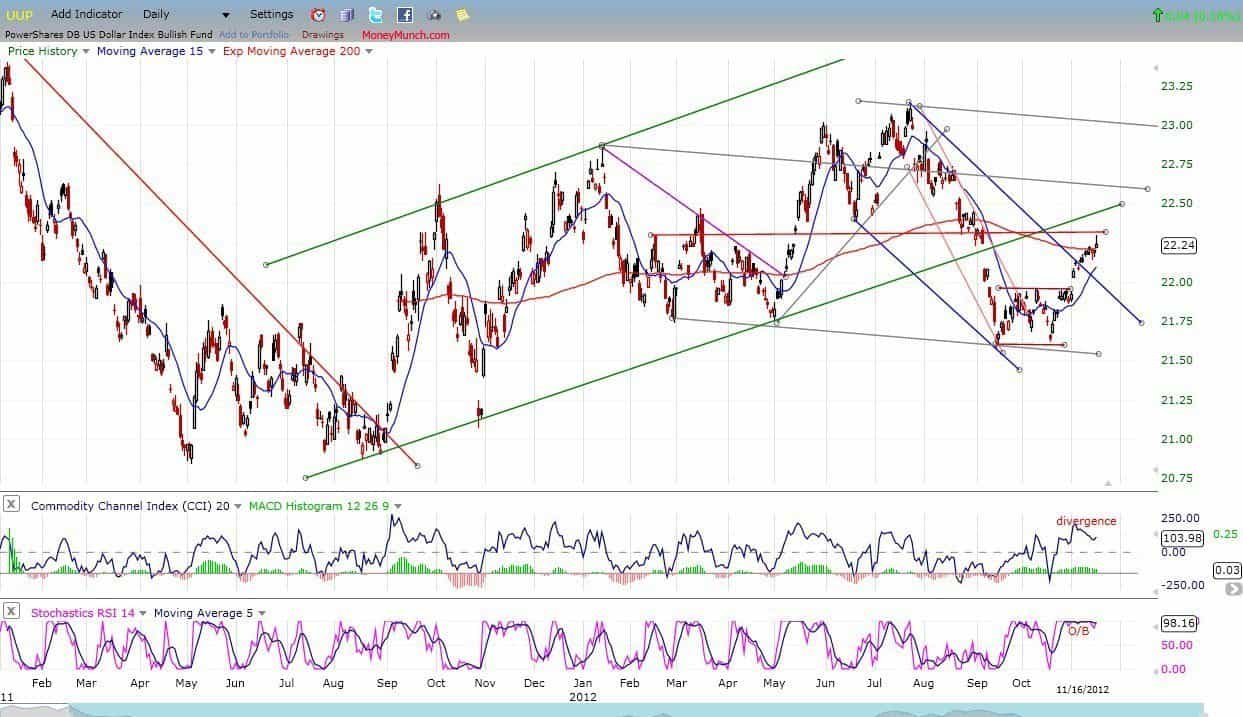
UUP normally goes against equities and gold. The index appears to be extended short-term and eady to pull-back. This can be seen in the indicators, one of which is very overbought and the other beginning to show some negative divergence. If a short-term top is forming, this should help the market to find a short-term low.

US Dollar ETC

Continue reading

Flag Trendline SP500 Update

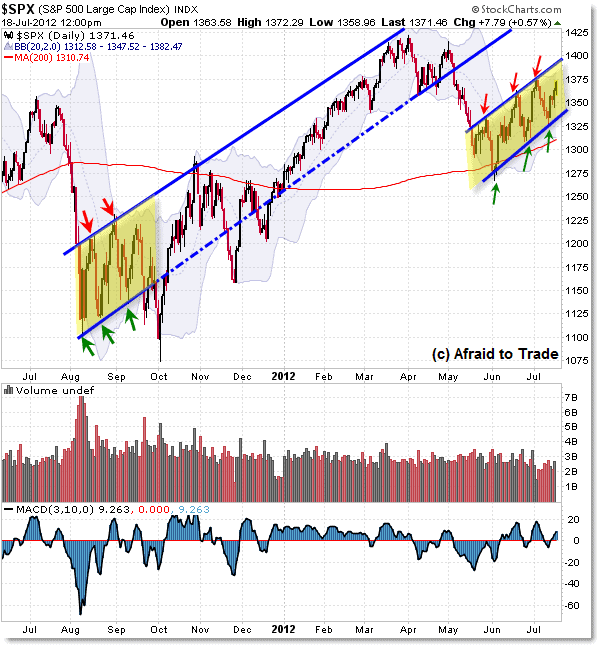
We’re hearing much talk about the potential Bear Flag pattern on the S&P 500 Daily Chart.

Let’s take a mid-week update on the pattern and note the current key price boundary levels to watch for clues.

First, here’s the S&P 500 Daily Chart trend-lines structure:

SP-500-Daily-Chart

Moving from right to left, we see the current “Bear Flag” consolidation pattern stretching from early June to present.

The lower rising trendline resides near 1,340 while the upper rising trendline continues near 1,390.  The 30-min chart below emphasizes these trendline levels.

Now, moving to the left of the chart, the last time we saw a similar Daily Chart ‘flag’ struture was from August to October 2011.

While price did break the downside trendline, the full downside target was NOT achieved due to a power-rally which developed off the 1,100 Index level.

From there, price structure continued to trade mostly in a “Creeper” uptrend, bound by the prior “flag” trendlines until the breakdown of May 2012.

To become a subscriber, subscribe to our free newsletter services. Our service is free for all.

Continue reading

Weekly Market Structure in S&P 500

S&P 500

Note the weekly bear flag on the S&P 500 index. You may call it by a number of different names (wedge, pullback, anti, flag, etc.), but the concept is the same: A period of contracting volatility with an upward bias following a sharp selloff. This pattern could be expected to resolve downward, providing a headwind for bearish trades over the next several weeks. Be aware that weekly patterns can take a long time to play out, and there is plenty of room for upswings on daily and intraday timeframes even if this weekly pattern resolves cleanly. Knowledge of higher-timeframe technical patterns often provides good context for trades on lower timeframes. This is an important part of understanding evolving market structure and potential technical risk factors.

To become a subscriber, subscribe to our free newsletter services. Our service is free for all.

Continue reading

Dow Jones Compated to Nifty Future

dow-jones-denifition

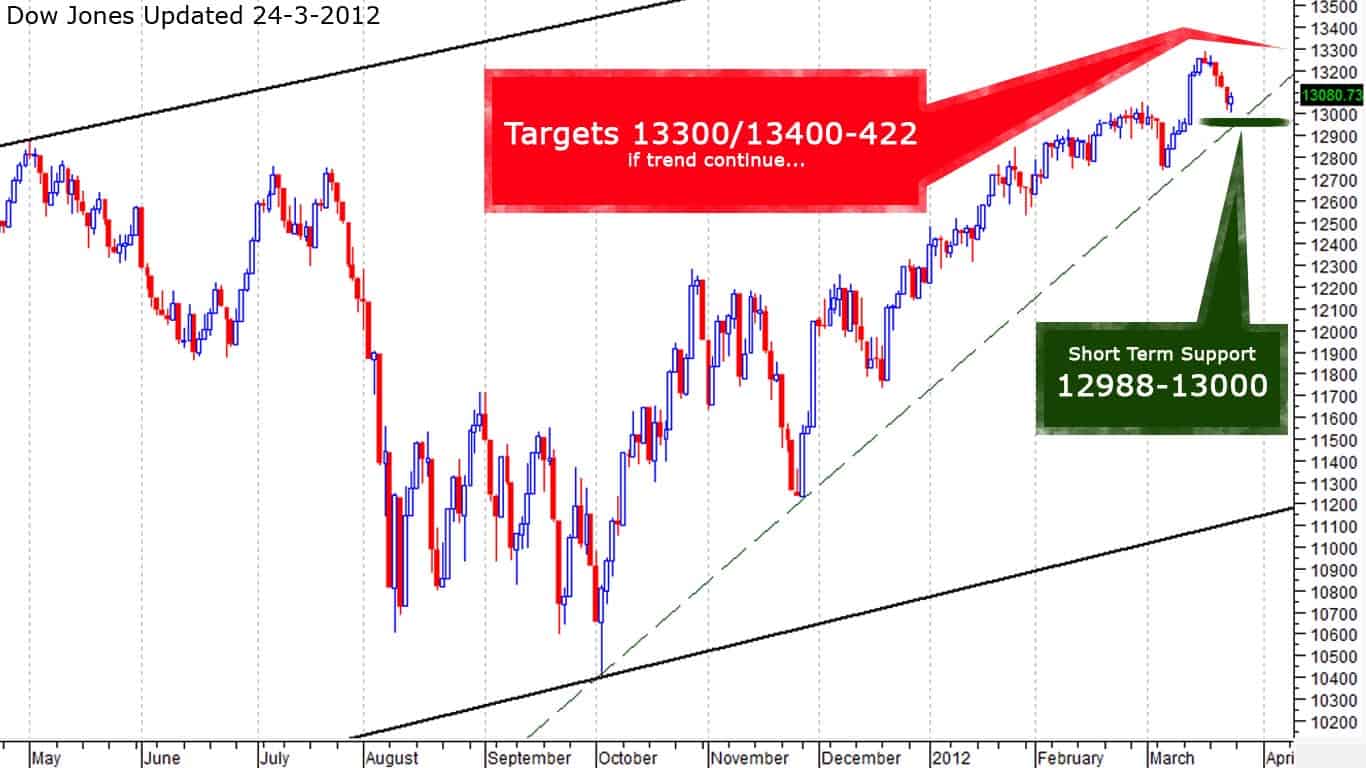
Dow Jones, Just Watch above Chart

Support: 12992 level around

Suppose to not breaking or close below it… then Dow Jones will test 13300 and 13400-422 very soon

In case, Dow Jones will breach to 12988-13000, then buyer will enter with heavy quantities but keep in mind… ”It should not good if close below it”.

Compared to Indian Nifty:

Buyer will act 5240-5258 and they intend will be 5348-5356 and also 5412-5448 above

In-case, Nifty close below 5240… then Targets 5176 and 5089

To become a subscriber, subscribe to our free newsletter services. Our service is free for all.

Continue reading