We’re hearing much talk about the potential Bear Flag pattern on the S&P 500 Daily Chart.
Let’s take a mid-week update on the pattern and note the current key price boundary levels to watch for clues.
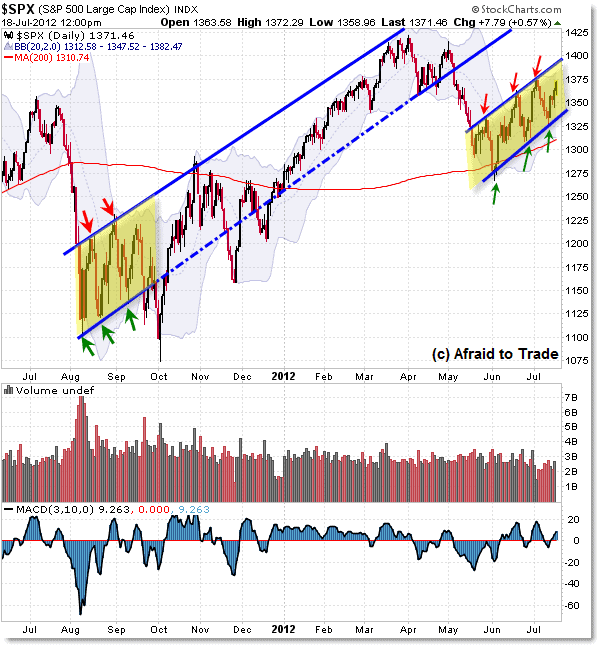
First, here’s the S&P 500 Daily Chart trend-lines structure:

Moving from right to left, we see the current “Bear Flag” consolidation pattern stretching from early June to present.
The lower rising trendline resides near 1,340 while the upper rising trendline continues near 1,390. The 30-min chart below emphasizes these trendline levels.
Now, moving to the left of the chart, the last time we saw a similar Daily Chart ‘flag’ struture was from August to October 2011.
While price did break the downside trendline, the full downside target was NOT achieved due to a power-rally which developed off the 1,100 Index level.
From there, price structure continued to trade mostly in a “Creeper” uptrend, bound by the prior “flag” trendlines until the breakdown of May 2012.
To become a subscriber, subscribe to our free newsletter services. Our service is free for all.
Get free forex & currency ideas, chart setups, and analysis for the upcoming session: Forex Signals →
Want to get premium trading alerts on GBPUSD, EURUSD, USDINR, XAUUSD, etc., and unlimited access to Moneymunch? Join today and start potentially multiplying your net worth: Premium Forex Signals
Premium features: daily updates, full access to the Moneymunch #1 Rank List, Research Reports, Premium screens, and much more. You΄ll quickly identify which commodities to buy, which to sell, and target today΄s hottest industries.
Have you any questions/feedback about this article? Please leave your queries in the comment box for answers.