Looking for reliable and free forex tips? Look no further than Moneymunch! We provide intraday and positional signals, forecasts, technical analysis, research reports, and daily or weekly charts on major forex pairs, commodities, and cryptocurrencies to help you make informed trading decisions in the forex market. Subscribe now and stay ahead of the game!
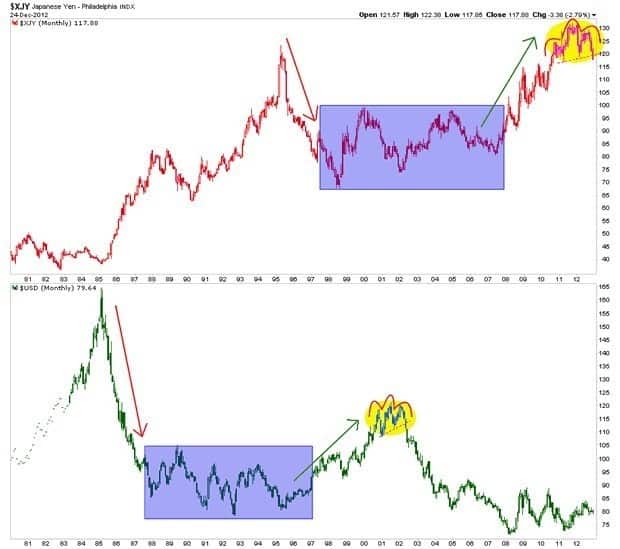
Japan is following in the footsteps of the man who laid the groundwork for the greatest global inflationary operation of the modern era. We see the Yen in the top panel of the chart below forming a similar pattern to that which USD made from 2000 to 2002 as an epic bubble in credit expansion was being fomented in the US.
The similarity in the charts (with a decade stagger) is striking and it is probably no coincidence that Japan has chosen to leverage its currency – which had been chronically strong since the 2007 beginnings of the US-triggered global financial meltdown – just as the US did with the once strong ‘King’ dollar in and around 2001.
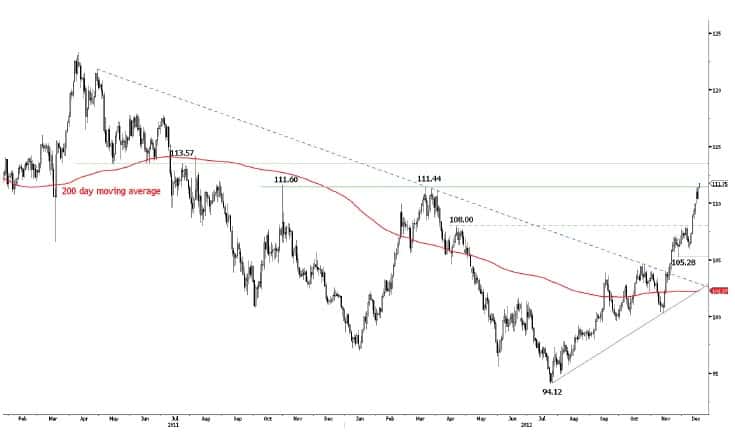
Challenging the strong resistance at 111.44/111.60. • EUR/JPY’s rise is overextended but, yesterday, it managed to make new highs. It is now challenging the strong resistance at 111.44/111.60. Given the general overbought conditions, we favour a phase of weakness in the next few days. • EUR/JPY has moved above its long-term downtrend (linking the October 2009 top with the April 2011 top). Monitor the test of the key resistance at 111.60 (31/10/2011 high).
Short 3 at 111.30, Objs: 110.35/108.10/106.10, Stop: 112.25
Bouncing on support at 1.2875. • EUR/USD has successfully tested the key support at 1.2875. Resistances for a bounce are given by 1.2973 (07/12/2012 high) and 1.3046 (04/12/2012 low). • The underlying trend is negative (see the succession of lower highs since May 2011 peak). Therefore we expect limited upside potential given the strong resistance at 1.3172 (17/09/2012 high) and the overall overbought conditions.
This is just a brief follow up since tomorrow morning I will be busy and today’s inconclusive price action with another small range body (Spinning Top) does not add anything new to the short-term potential scenarios I have discussed in the weekly technical update.
For the immediate time frame price remains range bound between the immediate support at 1398.23 and the immediate resistance at 1423.73.
Theoretically, despite being close to a potential break out the daily Spinning Top is suggesting weakening of upside momentum, but it is unlikely to expect a meaningful pullback ahead of the FOMC.
It seems that the market remains, so far, careless to Risk off news from Europe and a potential, at least, short-term reversal of the EUR, the approaching FOMC meeting may be the reason behind this benevolent attitude.
Therefore, at the moment there is no clear edge within the potential EWP options that I showed this Sunday.
Also, it is strange that at today’s EOD we have VIX up Equity up and bonds up.
Below in the 30 min SPX I show the same ideas:
Additionally, the scenario of a ZigZag with a wave (C) unfolding an Ending Diagonal is still possible as long as 1410.90 is not breached.
If this ED pattern plays out it could have a bearish outcome by ending the assumed wave (B) off the September 14 high since we would most likely have negative divergences in the final wave (V) of the ED.
Conclusion:
Regardless of a potential pullback I maintain a bullish bias (until technical evidence shifts to the bears camp) since the pattern off the November lows is not complete yet.
• EUR/USD has weakened after failing to break the resistance at 1.3140 (17/10/2012 high). Monitor the test of the key support at 1.2875. An hourly resistance is at 1.2973 (07/12/2012 high). Another support can be found at 1.2834 (intraday low).
• The underlying trend is negative (see the succession of lower highs since May 2011 peak). Therefore we expect limited upside potential given the strong resistance at 1.3172 (17/09/2012 high) and the overall overbought conditions.
My preferred wave count is similar to the idea I posted some weeks back on the DAX and that I suspect the SPX is inside a 5th wave for an ending diagonal so likely to chop higher into Jan-Feb period next year before a meaningful high. It would need a seriously strong break below the 200DMA on the SPX before I would switch to an alternative bearish idea, whilst this market continues higher I still prefer the bullish option over the bearish option.
Although I am certainly no perma bull and calling for SPX 2000 or anything like that, recent price action over the last few days suggests the market is simply correcting the advance from the Nov 2012 lows and likely to push higher once the correction has finished.
When you look at other US markets we can clearly see the same sort of shape, especially markets such as the NYSE. The last decline from the September 2012 highs was a 3 wave decline as we can clearly see the NYSE is pushing higher as I suspect it would, but is lacking the new high it needs to complete its idea.