I HAVE UNDERESTIMATED THE SCENARIO OF A DEEPER CORRECTION
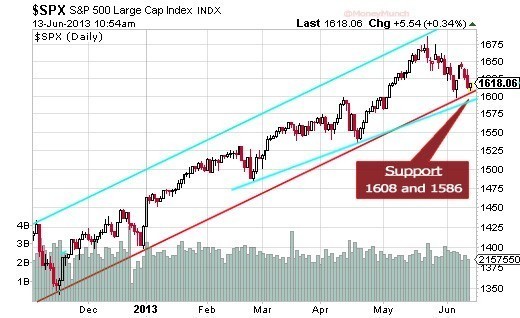
Incase of S&P 500 Index, printed below 1597 can open the DOOR to deeper correction towards the area of 1567 to 1497.
Pray to The God for taking support as 1597 to 1608
Continue reading
Looking for reliable and free forex tips? Look no further than Moneymunch! We provide intraday and positional signals, forecasts, technical analysis, research reports, and daily or weekly charts on major forex pairs, commodities, and cryptocurrencies to help you make informed trading decisions in the forex market. Subscribe now and stay ahead of the game!
 I MAINTAIN UNCHANGED THE CALL OF A TEMPORARY TOP
Therefore my strategy is to sell the rip.
My road map can be seen in the SPX daily chart below:
The main themes are:
Before moving on with the weekly technical update I have to bring forward the following technical issues that will affect the progress of the expected pullback:
Weekly Momentum Indicators have to confirm the kick-off of the expected pullback:
Lets move on to analyze the SPX charts.
Friday’s reaction to a poor NFP (Investors are judging that bad economic numbers will maintain Quantitative Easing into infinity) has left in the chart a bullish Hammer which is suggesting follow through to the upside at least for next Monday.
I don’t know how long the bounce will last (Attempt of the bulls to kill the bearish set up). If it is chop up and down (But below 1564) during next week then price could be forming the right shoulder of a H&S that has a target at 1505, otherwise if it is just 1-2 days rebound what really matters is a lower high.
If the bearish set up pans out, remember the oversold McClellan Oscillator, if the assumed pending down leg is impulsive it could stop either at the 0.618 retracement (1519) or at 1505 (If the H&S pans out) from where I expect a large bulls’ countertrend attack.
Regarding the short-term price action, in my opinion, SPX from last week top has unfolded a Double ZigZag wave (A) therefore the initial pattern of the expected larger correction should be a ZigZag down.
The expected wave (B) rebound in progress can also unfold a ZigZag since I doubt that at Friday’s hod the counter trend bounce has topped, hence the potential target should be located in the 1561 +/- area. Bulls will probably try to form an inverted H&S with the neckline at 1561.78 (Eventually it should result in a bull’s trap).

Nasdaq: Going forward this the third stock index that I will closely monitor.
Why?
Because the 200 DMA is standing above the February 26 reaction low, ONLY 2% below Friday’s EOD print, which should be the right spot for the kick-off of a large countertrend fight from the bulls (bottom or temporary halt of a larger corrective pattern). If eventually the 200 DMA is breached, it will issue a sell signal to the majority of institutional investors.
If the 200 DMA is breached then maybe the large Triangle wave (B) option could pan out:
I will update to night weekly update of world markets.
Just watch S&O 500 Candle stick charts
“NEVER BEFORE HAVE YOU HAVE SEEN THIS PERFECTION OF CHART ANALYSIS“
As expected, Dow Jones and S&P 500 have been started to fall down. Let’s start by looking Nifty future…, Yes we are waiting for long “Expected time is 2-3day for long” Click here.
Yes, You can short-sell Nifty for 5928-5947 small points.
To become a subscriber, subscribe to our free newsletter services. Our service is free for all.
My short-term scenario has proven to be wishful thinking. I was looking for a potential Zigzag down instead the bulls have once again aborted a pullback that in my opinion has been delayed but not removed from a pending outcome.
Regarding the long-term count, I maintain the scenario of a potential Ending Diagonal. If it pan out it will complete the Double Zigzag wave (X) off the March 2009 low establishing a major top.
But instead of an expecting a larger subdivision of the wave (III) maybe price is approaching the end of this wave. If this is the case then once the wave (III) is in place in the next down leg, in order to be considered the wave (IV) of the Ending Diagonal, it will have to overlap below the peak of the wave (I). The potential target for the wave (IV) could locate in the range 1463.76 – 1435.50.In addition, if the Dow is unfolding the same ending pattern, then the wave (III) cannot exceed above 14089.64 therefore there is not much more upside left in order to maintain valid this option.
To become a subscriber, subscribe to our free newsletter services. Our service is free for all.Moving Avg-Exponential Indicator:
Conventional Interpretation: Price is above the moving average so the trend is up.
Trend: Market trend is UP.
Mov Avg 3 lines Indicator:
Note: In evaluating the short term, plot1 represents the fast moving average, and plot2 is the slow moving average. For the longer term analysis, plot2 is the fast moving average and plot3 is the slow moving average
Conventional Interpretation – Short Term: The market is bullish because the fast moving average is above the slow moving average.
Additional Analysis – Short Term: The market is EXTREMELY BULLISH. Everything in this indicator is pointing to higher prices: the fast average is above the slow average; the fast average is on an upward slope from the previous bar; the slow average is on an upward slope from the previous bar; and price is above the fast average and the slow average.
Conventional Interpretation – Long Term: The market is bullish because the fast moving average is above the slow moving average.
Additional Analysis – Long Term: The market is EXTREMELY BULLISH. Everything in this indicator is pointing to higher prices: the fast average is above the slow average; the fast average is on an upward slope from the previous bar; the slow average is on an upward slope from the previous bar; and price is above the fast average and the slow average.
Bollinger Bands Indicator:
Conventional Interpretation: The Bollinger Bands are indicating an overbought market. An overbought reading occurs when the close is nearer to the top band than the bottom band.
Additional Analysis: The market appears overbought, but may continue to become more overbought before reversing. Given that we closed at a 45 bar new high, the chance for further bullish momentum is greatly increased. Look for some price weakness before taking any bearish positions based on this indicator.
Volatility Indicator: Volatility is in a downtrend based on a 9 bar moving average.
Momentum Indicator:
Conventional Interpretation: Momentum (1000.11) is above zero, indicating an overbought market.
Additional Analysis: The long term trend, based on a 45 bar moving average, is UP. The short term trend, based on a 9 bar moving average, is UP. Momentum is indicating an overbought market, and appears to be slowing. A modest downturn is possible here.
Rate of change Indicator:
Conventional Interpretation: Rate of Change (7.69) is above zero, indicating an overbought market.
Additional Analysis: The long term trend, based on a 45 bar moving average, is UP. The short term trend, based on a 9 bar moving average, is UP. Rate of Change is indicating an overbought market, and appears to be slowing. A modest downturn is possible here.
Comm Channel Index Indicator:
Conventional Interpretation: CCI (170.27) recently crossed above the buy line into bullish territory, and is currently long. This long position should be liquidated when the CCI crosses back into the neutral center region.
Additional Analysis: CCI often misses the early part of a new move because of the large amount of time spent out of the market in the neutral region. Initiating signals when CCI crosses zero, rather than waiting for CCI to cross out of the neutral region can often help overcome this. Given this interpretation, CCI (170.27) is currently long. The current long position position will be reversed when the CCI crosses below zero. Adding bullish pressure the market just reached a 45 bar new high.
RSI Indicator:
Conventional Interpretation: RSI is in neutral territory. (RSI is at 66.70). This indicator issues buy signals when the RSI line dips below the bottom line into the oversold zone; a sell signal is generated when the RSI rises above the top line into the overbought zone.
Additional Analysis: RSI is somewhat overbought (RSI is at 66.70), but given the 45 bar new high here, greater overbought levels are likely.
MACD Indicator:
Conventional Interpretation: MACD is in bullish territory, but has not issued a signal here. MACD generates a signal when the FastMA crosses above or below the SlowMA.
Additional Analysis: The long term trend, based on a 45 bar moving average, is UP. The short term trend, based on a 9 bar moving average, is UP. MACD is in bullish territory. And, the market just put in a 45 bar new high here. Look for more new highs.
Open Interest Indicator: No open interest value in the database for this bar. Note: Open interest not available for all data types.
Volume Indicator:
Conventional Interpretation: The current new high is not accompanied by increasing volume, suggesting that the current move lacks broad participation. Look for a retracement soon.
Additional Analysis: The long term market trend, based on a 45 bar moving average, is UP. The short term market trend, based on a 5 bar moving average, is UP.The current new high is not accompanied by increasing volume, suggesting that the current move lacks broad participation and the market may be overbought. A retracement is possible here.
Stochastic – Fast Indicator:
Conventional Interpretation: The stochastic is in overbought territory (SlowK is at 96.91); this indicates a possible market drop is coming.
Additional Analysis: The long term trend is UP. The short term trend is UP. Even though the stochastic is signaling that the market is overbought, don’t be fooled looking for a top here because of this indicator. The stochastic indicator is only good at picking tops in a Bear Market (in which we are not). Exit long position only if some other indicator tells you to.
Stochastic – Slow Indicator:
Conventional Interpretation: The stochastic is in overbought territory (SlowK is at 94.33); this indicates a possible market drop is coming.
Additional Analysis: The long term trend is UP. The short term trend is UP. Even though the stochastic is signaling that the market is overbought, don’t be fooled looking for a top here because of this indicator. The stochastic indicator is only good at picking tops in a Bear Market (in which we are not). Exit long position only if some other indicator tells you to.
Swing Index Indicator:
Conventional Interpretation: The swing index is most often used to identify bars where the market is likely to change direction. A signal is generated when the swing index crosses zero. No signal has been generated here.
Additional Analysis: No additional interpretation.
Important: This commentary is designed solely as a training tool for the understanding of technical analysis of the financial markets. It is not designed to provide any investment or other professional advice.