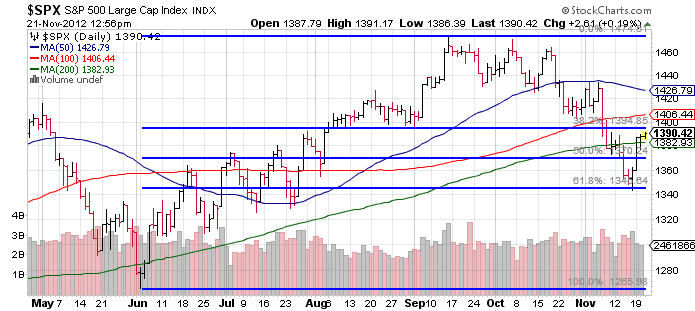
While things are never easy, the (quote-unquote) obvious trade in the major indexes has now played out, especially on the S&P 500. Of course most of it happened in an overnight gap up, but that has been par for the course. From here things get more complicated. Here are a few ways to look at the roadmap utilizing the S&P 500.
First the original S&P 500 chart that has been in play for months, looking at the June-Sep run, and pullback since. Two key points here – the index has bounced from the 61.8% retrace to nearly the original 38.2% retrace at ~1395. That number is also key in that it was support multiple times in August 2012. Support turns into resistance and vice versa so this 1395 level is a very obvious level to watch.
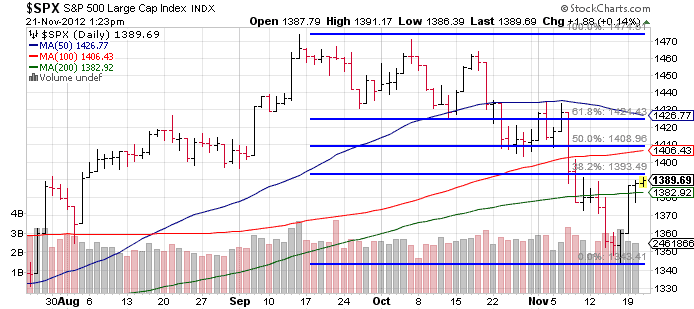
Second, is the chart I posted yesterday morning which is simply the same Fibonacci levels but focused solely on the September-November pullback. What’s the first number that sticks out? 1394 (call it 1395, close enough for government work). That is the 38.2% retrace of the two month correction.
If 1395 is vanquished, the next two levels are 1409 to 1424 which you can see was an area with a lot of traffic in late October to early November before the correction became much more ferocious. That second number also coincides with a falling 50 day moving average.
Last, on a very short term frame there is a potential for an inverse head and shoulders formation (which favors bulls) in the near term. The head being Thursday/Friday’s lows and the neckline being about “here” at 1390. If that does play out, it measures to a target of ~1430. That would be a 3% move from here.. and still not create a new higher high versus those early November levels. Hence all that could in theory happen and still bode poorly afterwards. But either way, one can see all the congestion and push pull in the areas overhead.
Of course all this coincides with positive seasonality, the constant negotiations re: the fiscal cliff, the next round of easing to be announced at December’s FOMC meeting (to replace Operation Twist), and a slowing corporate earnings outlook.
Anyhow enjoy the Thanksgiving holiday and we’ll catch you on the other side.
Get free forex & currency ideas, chart setups, and analysis for the upcoming session: Forex Signals →
Want to get premium trading alerts on GBPUSD, EURUSD, USDINR, XAUUSD, etc., and unlimited access to Moneymunch? Join today and start potentially multiplying your net worth: Premium Forex Signals
Premium features: daily updates, full access to the Moneymunch #1 Rank List, Research Reports, Premium screens, and much more. You΄ll quickly identify which commodities to buy, which to sell, and target today΄s hottest industries.
Have you any questions/feedback about this article? Please leave your queries in the comment box for answers.

