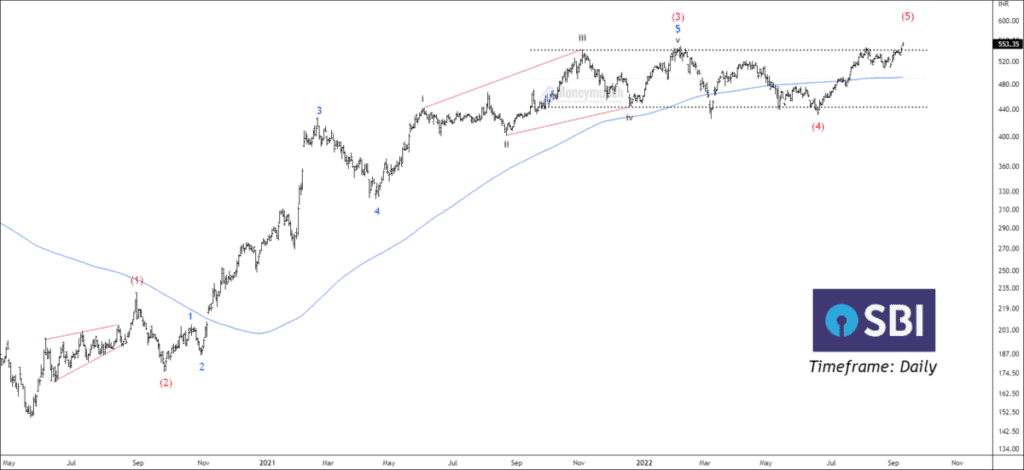
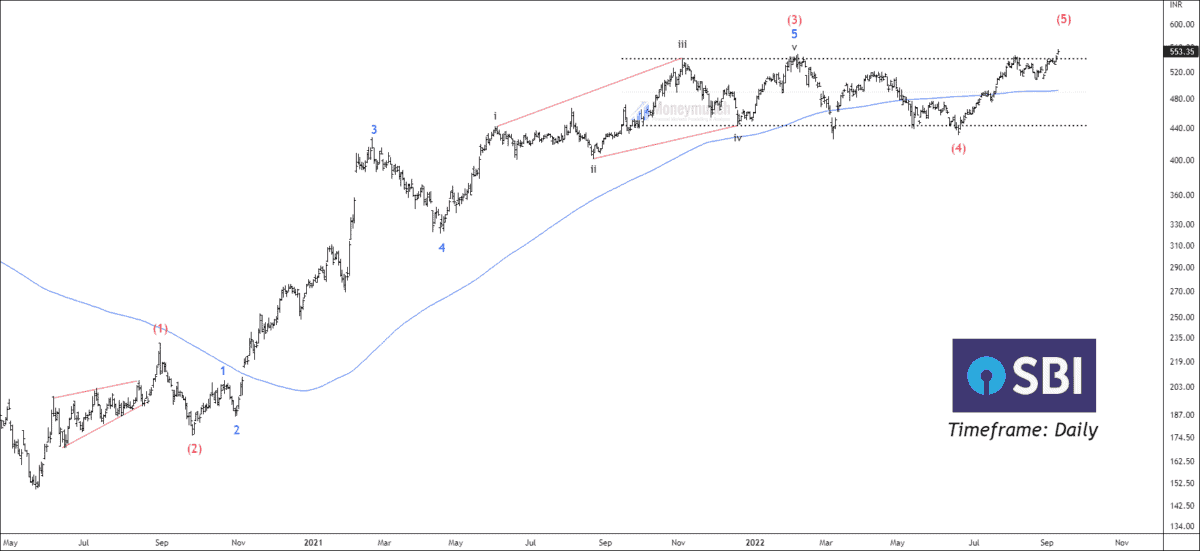
Timeframe: Daily
SBI BANK has given a breakout of the 13-month-old Correction. RSI is above 65, and the price trading above 200 EMA.
At present, SBIN has accomplished the corrective wave (4) and started forming an impulsive wave (5). Price has already crossed the 1.00 Fibonacci extension of waves (1) through (3), so our next target should be Fibonacci’s extension of 1.618.
Wave 4 was a choppy move as a triangle. As the price has crossed the 1.00 Fibonacci retracement, safe traders should wave for a pullback. If the price sustains above 442, traders can trade above the following targets: 555 – 566 – 575+.
Invalidation: The 540 level was strong resistance, but now it is a crucial level. Failure of stability will deactivate this setup. Please note that we can’t trade without proper risk management. The absence of risk management can wipe out your whole account.
To become a subscriber, subscribe to our free newsletter services. Our service is free for all.
Get free important share market ideas on stocks & nifty tips chart setups, analysis for the upcoming session, and more by joining the below link: Stock Tips
Have you any questions/feedback about this article? Please leave your queries in the comment box for answers.


Nice insight!
Having the best service from money munch since 2018.
Very few analysts have an accuracy of more than 90%. Love your ideas from Philadelphia, Pennsylvania.
Thanks for your Setups, nice to read. Do not stop.