
I’m using 3 different chart patterns to find out NSE Tech Mahindra stock trend for upcoming days.
- Monthly Chart: Price Action
- Weekly Chart: Head and Shoulders Pattern
- Daily Timeframe Chart: Ellott Wave Theory
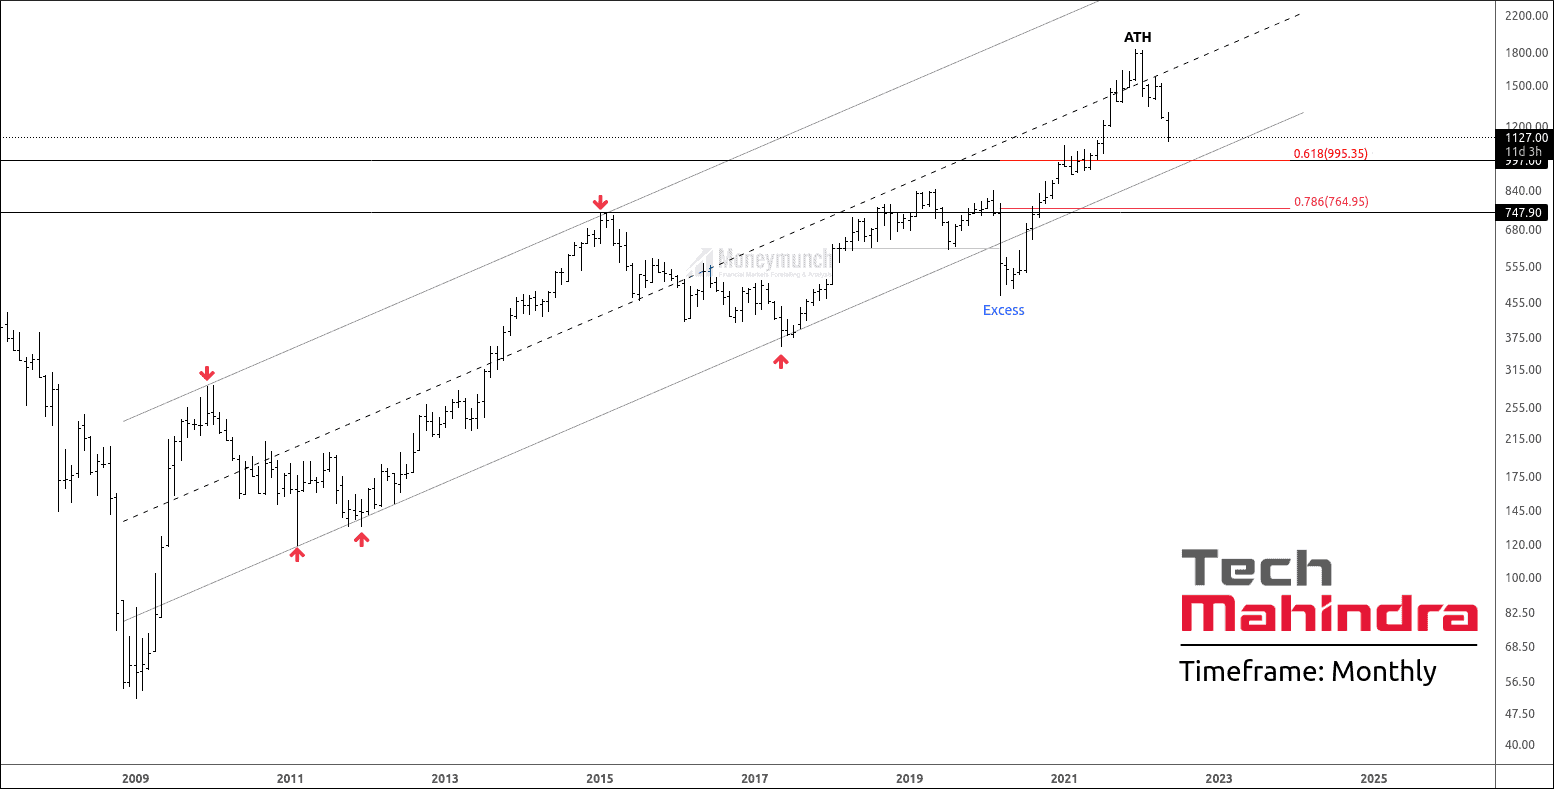
I. Monthly Timeframe Chart – Price Action
After making an all-time high(ATH) in 1838, prices have started collapsing to correct the previous move.
The fair value area has given two resistance on the upper band, and four supports on the lower band of the channel. Excess is showing that sellers are very aggressive with their inconvenience levels.
Key Level clusters:
1) 995 Level
- Fibonacci level of 61.8%
- A lower band of the parallel channel
- Monthly support level
2) 764 Level
- Fibonacci level of 78.6%
- Monthly support level at 747
These are Strong reversal zones for tech Mahindra. If the price takes support at this level, we can see an impulsive move in upward direction. Breakout of the channel will lead to 2nd key-level and more bearish.
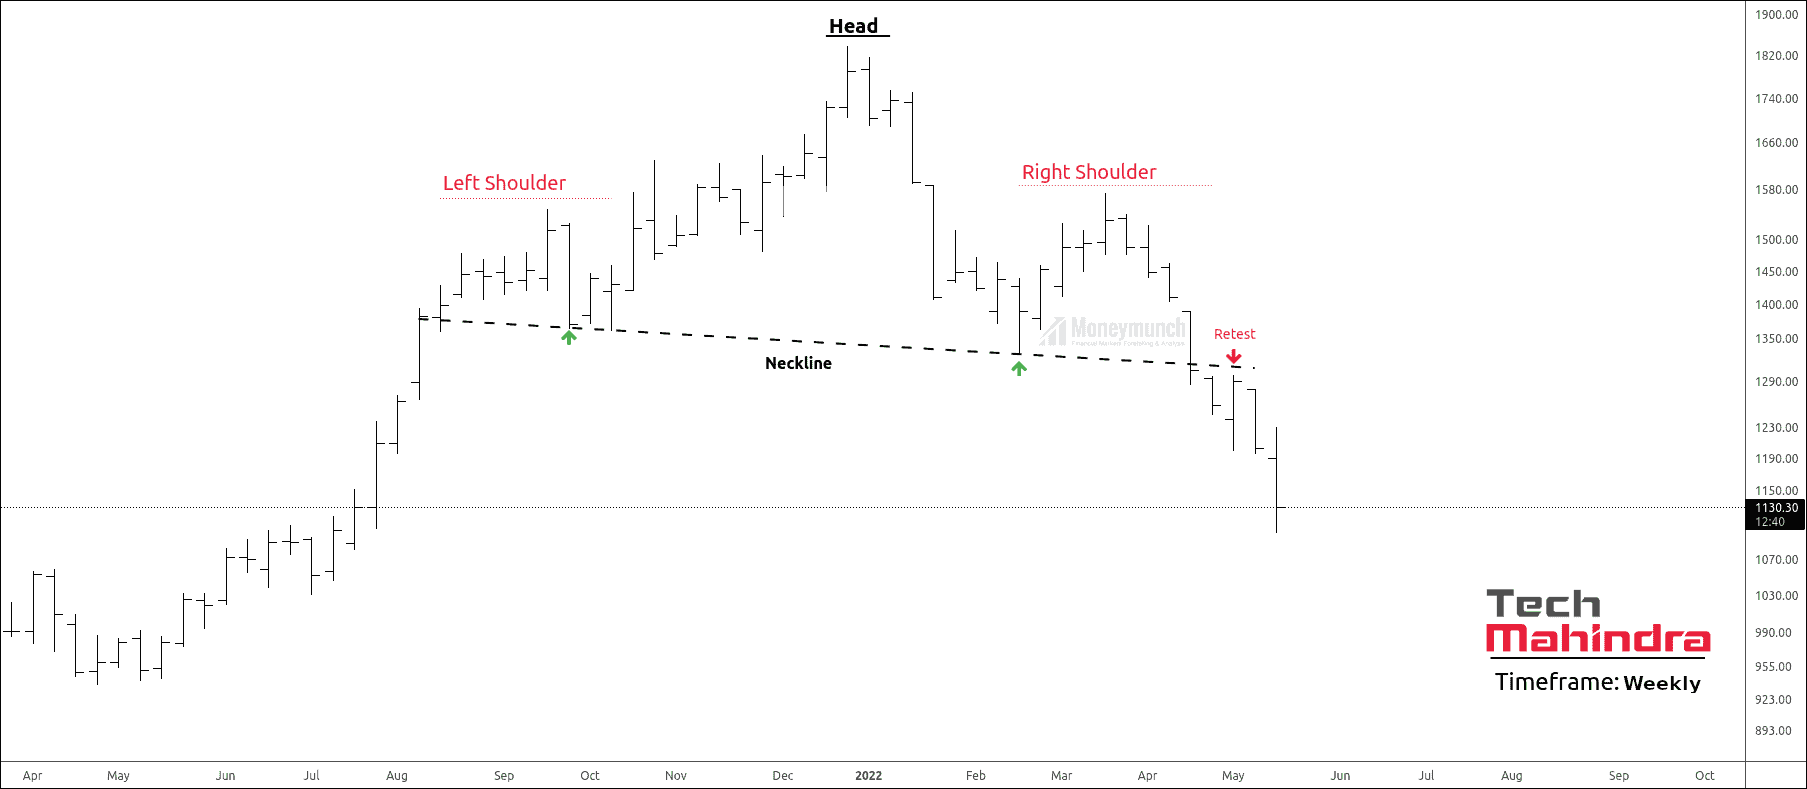
II. Weekly Timeframe Chart – Head and Shoulder Pattern
The weekly timeframe gives information about the bearish atmosphere. Price has formed head & shoulders on the weekly timeframe.
Supply pressure has broken down the neckline with a retest at 1302. H & S target measurement says that price can fall up to 955.
(Base scale: distance from head to neckline)
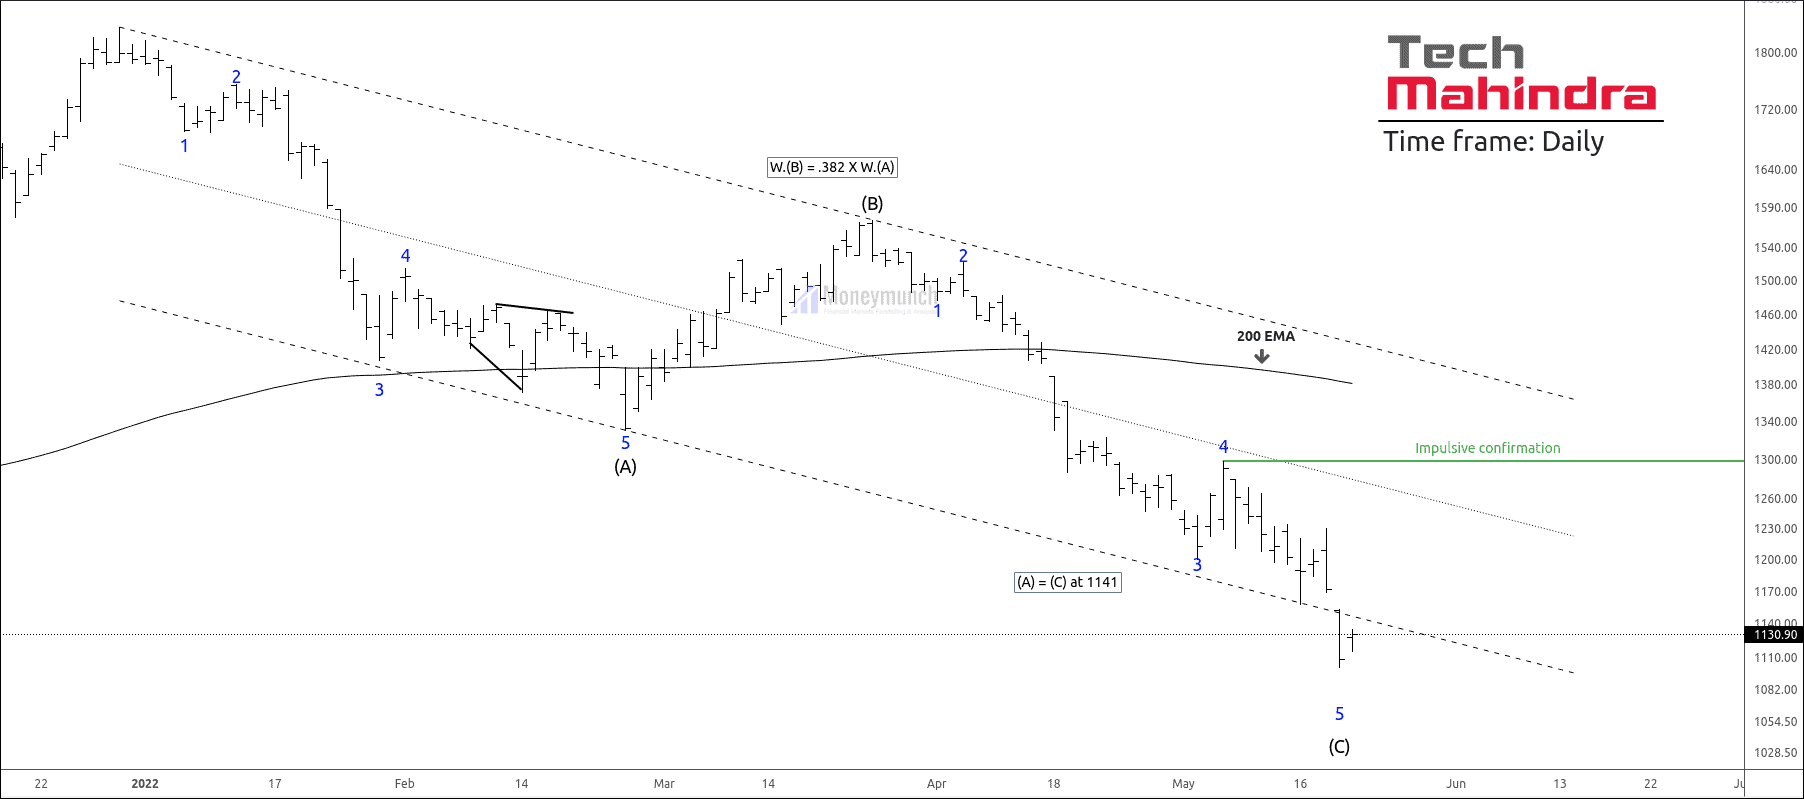
III. Daily Timeframe Chart – Elliott Wave Theory
After creating a high of 1838, the price has to fall for the corrective phase. Price has completed the corrective wave (B) and started occurring wave (C) of the correction phase.
We are clueless about trend reversal because the price is out of the parallel channel.
If the price sustains below the lower band of the parallel channel. Traders can trade for the following targets: 1064 – 1006 – 995.
Please note that 955 is our monthly support level, so we can also initiate the buy position when the price sustains above it.
The entrance of price into the parallel channel may lead short-term bullish perspective.
I am not admire falling knives. If the price enters the parallel channel, traders can buy for the following targets: 1180 – 1234 – 1299 – 1800. Trend change is unacceptable until the breakout of high of wave 4 of lower degree.
I will upload further information soon.
To become a subscriber, subscribe to our free newsletter services. Our service is free for all.
Get free important share market ideas on stocks & nifty tips chart setups, analysis for the upcoming session, and more by joining the below link: Stock Tips
Have you any questions/feedback about this article? Please leave your queries in the comment box for answers.
I have bought your yearly package for NSE calls yesterday. Will I get TECHM’s trade plan in your mobile application?
Yes, you will get an intraday & positional trade setup of Tech Mahindra stock on Monday in our mobile app during the market hours. You’re a premium subscriber, sir.
Very good and clearly commented. Very nice Theories and trading tools for implication in the real market. Keep it up.
Thank you Mr.Sathish!
It sector ke dusre stocks bhi girrahe he. Unmese TCS ka research kijye sir. Thank you for your amazing work.
Thank you for your valuable feedback. We will.
Nice and unique analysis
I like it. Good explanation and implementation of different. Learning every day from your charts. Thank you…