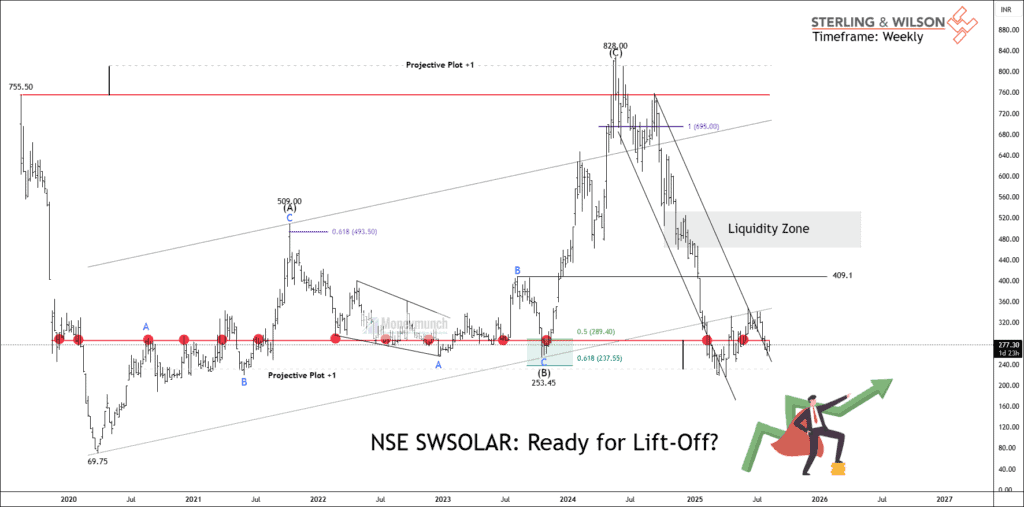

Timeframe: Weekly
NSE SWSOLAR has formed an ABC formation from the low of 69.75. Wave A ended at 509, Wave B occurred at 253.49, and Wave C was completed at 828. Following the completion of Wave (C), the price declined by 73.67%. The weekly ADX stands at 22.41, while the ATR is 35.23. The price has rebounded from the pivot line, which has provided 11 instances of support and triggered three major upward moves.
The overall (A)-(B)-(C) formation can be labeled as Primary Wave ((B)) from a larger perspective, with the price now beginning to decline for the final Wave ((C)). A short-term bullish scenario is possible after a breakout above 350, which could drive the price to 409 at Wave B. Once the price breaks above Wave B at 409, it will be positioned to surge toward the liquidity zone. The current price is within an indecisive support zone ranging from 228 to 280, a range that also served as support during the COVID-19 period. The long-term bullish targets for this setup are 600 – 820+. Traders should observe the chart plots, which indicate the potential outcome for either buyers or sellers.
We will soon provide shorter-timeframe analysis to our premium members.
Get free important share market ideas on stocks & nifty tips chart setups, analysis for the upcoming session, and more by joining the below link: Stock Tips
Have you any questions/feedback about this article? Please leave your queries in the comment box for answers.
Keep up the good work! 🚀
Thx for the suggestion!
Kindly share more wave analysis charts like this.
I just wanted to let you know that I am now a premium subscriber
I am very interested in purchasing a premium subscription based on the quality of the analysis you have provided.