Nifty has given a strong close on the monthly timeframe and again came into the reversal zone. According to the monthly timeframe, there is no real body above 17800. Nifty entered into the territories on wicks. Can you imagine one bullish candle can onboard the target of 19000 in every advisor’s notebook? Yes, it’s true.
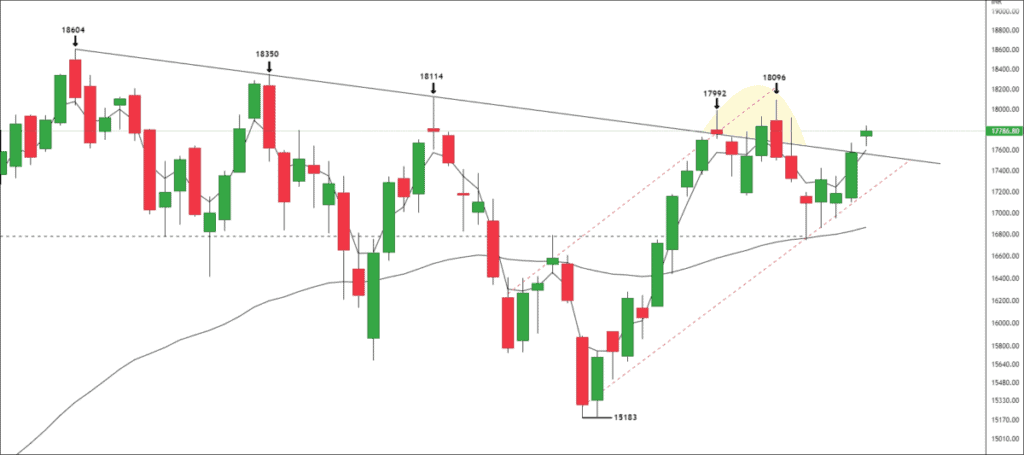
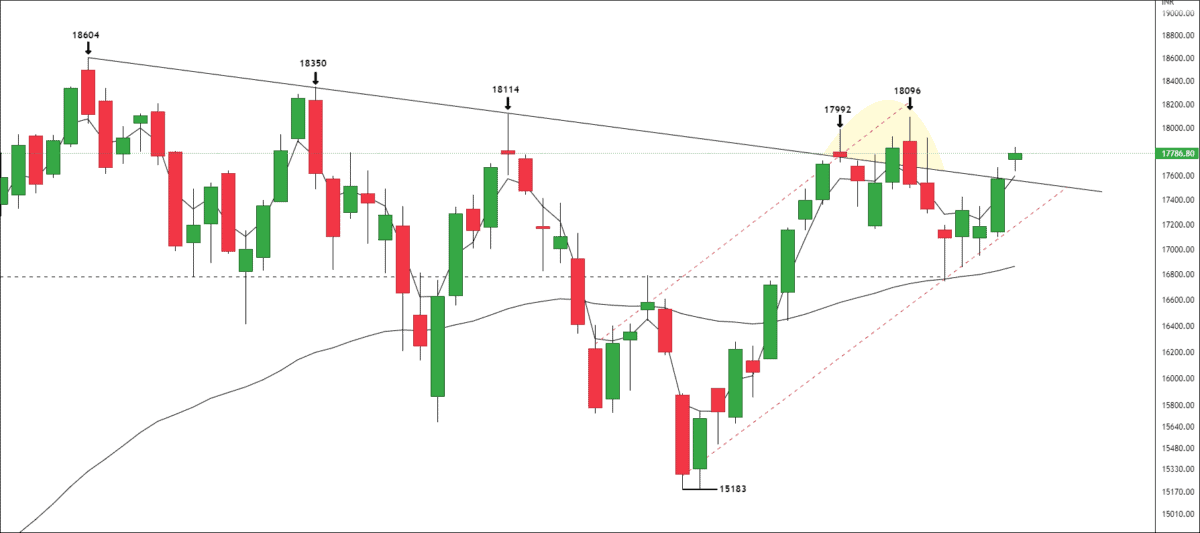
Looking at the monthly timeframe, you can see that price has broken down a long-term corrective trendline after five consecutive failures. I again have a question that, every breakout is fake-out? Price hasn’t broken out the volume of corrective formation on the monthly timeframe.
In addition, prices have to sustain above the previous highs at 18114 to continue the bullish momentum. We may witness some retracement moves. If there is a trend reversal from the swing highs, we will look at our weekly channel for support, swing trade, or breakdown.
To become a subscriber, subscribe to our free newsletter services. Our service is free for all.
Get free important share market ideas on stocks & nifty tips chart setups, analysis for the upcoming session, and more by joining the below link: Stock Tips
Have you any questions/feedback about this article? Please leave your queries in the comment box for answers.
You have a great command of technical analysis. Keep it up!
solid overview and great charting today
the same area of interest here. I totally agree with your analysis.