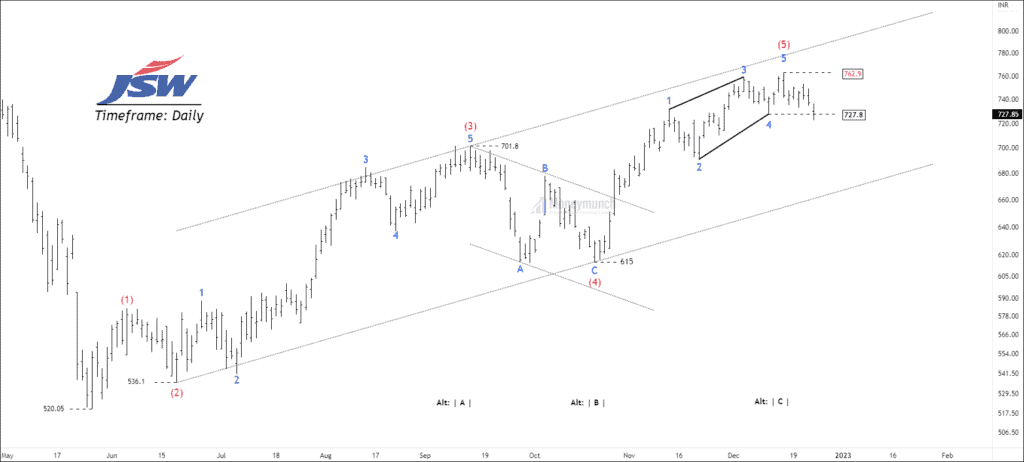
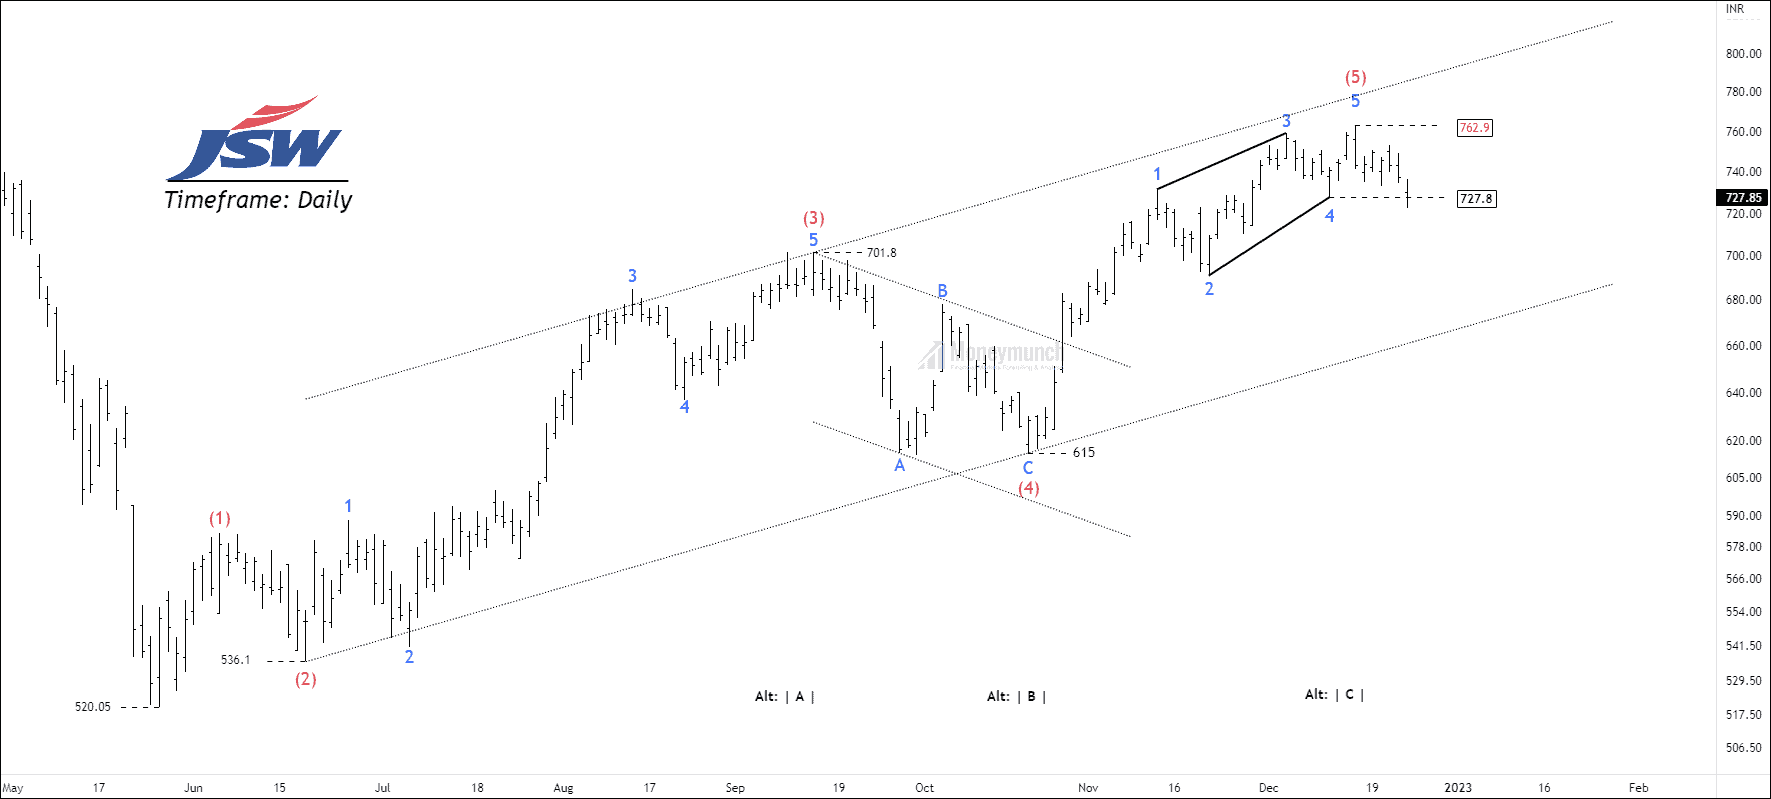
Timeframe: daily
According to the chart, the price has formed an impulsive cycle at 520, which it accomplished at 762. As of now, JSW is trading in the base channel of the impulsive structure.
Traders can alternate this count with A, B, and C waves. The structure of wave 5 is an ending diagonal, indicating the trend is coming to an end.
If the price breaks down the low of wave 4 of the ending diagonal at 727.8, traders can trade for the following targets: 710 – 692 – 671. Hence, It will confirm a downtrend.
In addition, Support from the low of the 4th wave will lead new high or consolidation in the range of 762.9 – 727.8.
I will update further information soon.
Get free important share market ideas on stocks & nifty tips chart setups, analysis for the upcoming session, and more by joining the below link: Stock Tips
Have you any questions/feedback about this article? Please leave your queries in the comment box for answers.
good insight
Thank you for this idea. looking forward to more stock charts.
Masterpiece!!!!!
Good pick and accurate wave projection