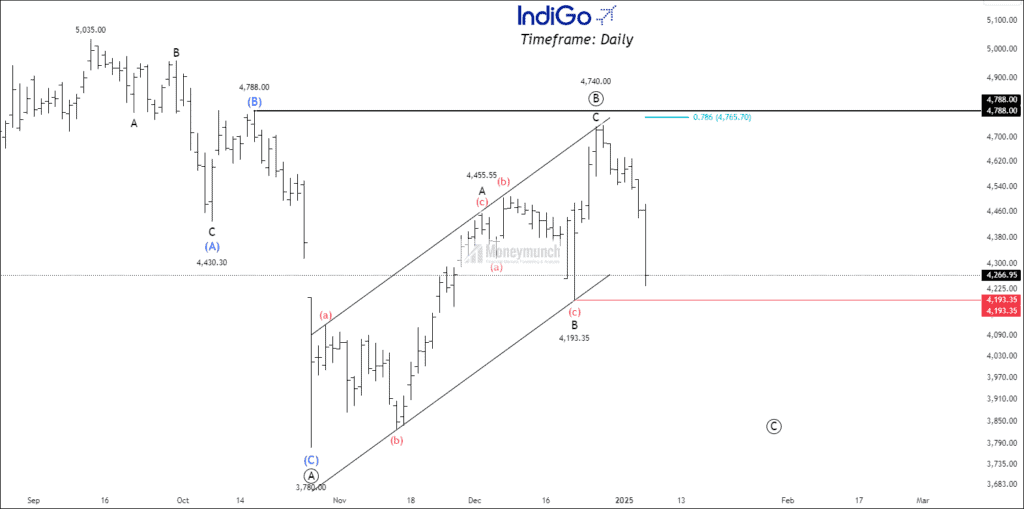
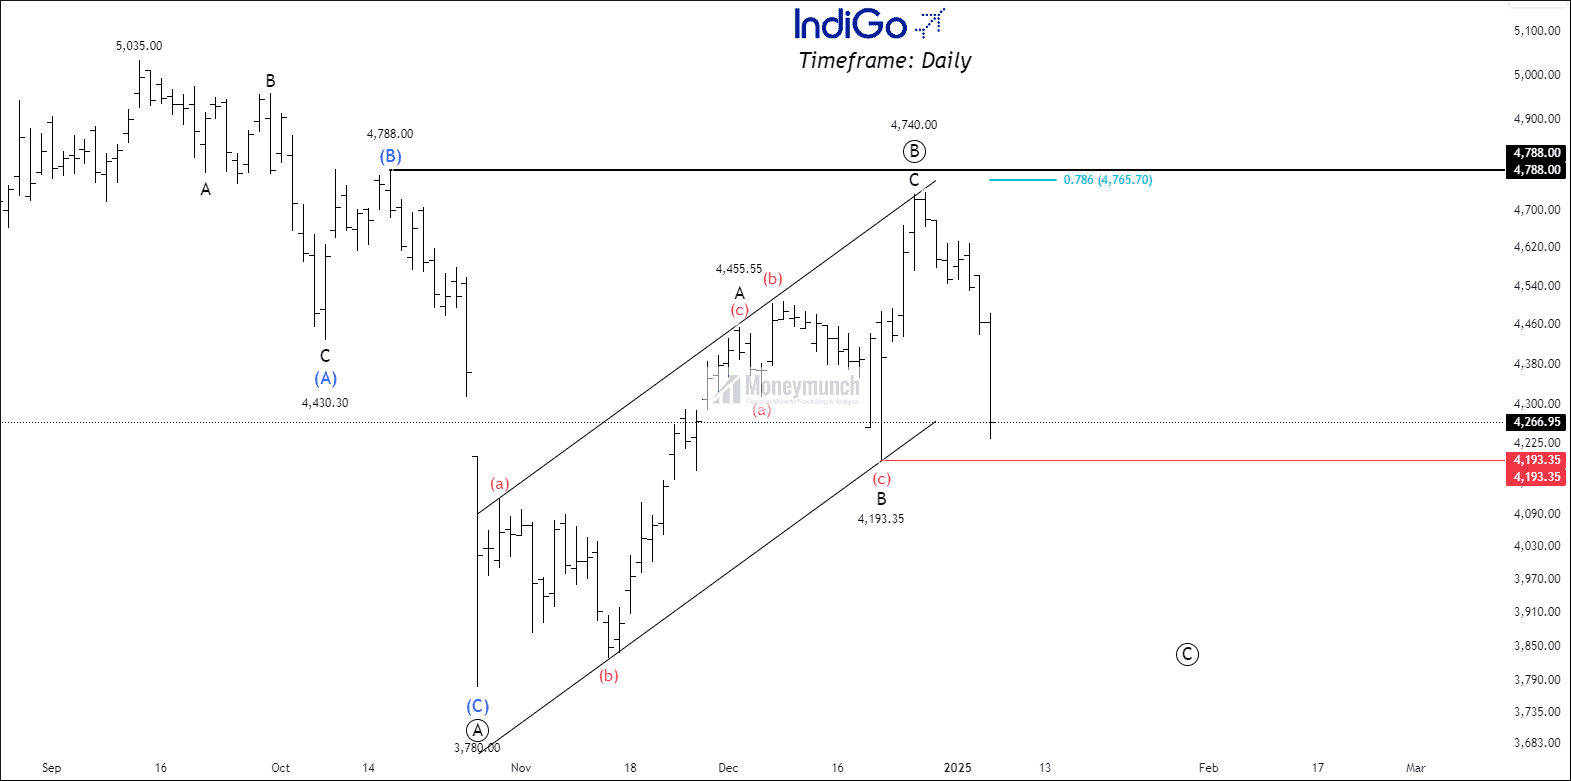
Timeframe: Daily
On the daily timeframe chart, NSE INDIGO shares present a mixed outlook. Yesterday’s candle broke below the 20, 50, and 100 EMAs, with the price now moving towards the 200 EMA. The ATR has increased to 122.17, while the ADX stands at 15, indicating low trend strength. The price has completed wave ((B)) and is now initiating the downward final wave ((C)).
 Unlock This Article
Only subscribers can read the full article. Please login to read the entire article.
Get free important share market ideas on stocks & nifty tips chart setups, analysis for the upcoming session, and more by joining the below link: Stock Tips
Have you any questions/feedback about this article? Please leave your queries in the comment box for answers.
Disclaimer: The information provided on this website, including but not limited to stock, commodity, and forex trading tips, technical analysis, and research reports, is solely for educational and informational purposes. It should not be considered as financial advice or a recommendation to engage in any trading activity. Trading in stocks, commodities, and forex involves substantial risks, and you should carefully consider your financial situation and consult with a professional advisor before making any trading decisions. Moneymunch.com and its authors do not guarantee the accuracy, completeness, or reliability of the information provided, and shall not be held responsible for any losses or damages incurred as a result of using or relying on such information. Trading in the financial markets is subject to market risks, and past performance is not indicative of future results. By accessing and using this website, you acknowledge and agree to the terms of this disclaimer.
Great attention to detail on this chart! Your support and resistance levels are crystal clear. 💯
This wave count is perfect, its a textbook example of advanced technical analysis!
Good share! The way you’ve connected the dots is just amazing!
Outstanding analysis! You’ve identified key market patterns with precision.