
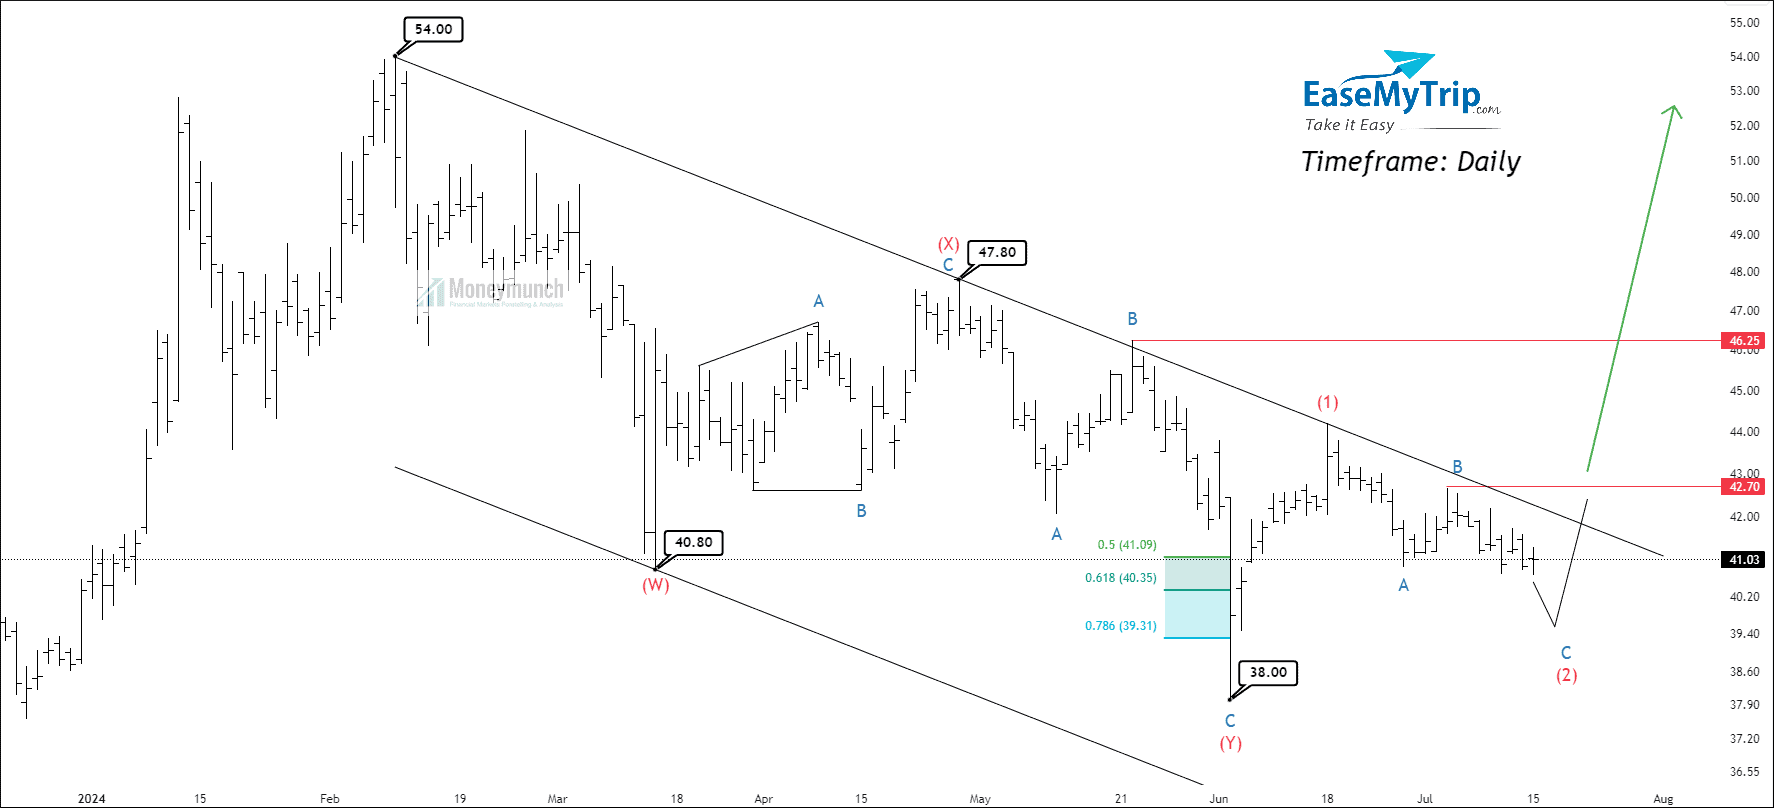
Timeframe: Daily
After reaching a peak of 54, NSE EASEMYTRIP has formed a double zig-zag pattern on the daily timeframe chart. The ADX has declined to 13.46, while the ATR has decreased to 0.91. Furthermore, the price is trading below the 20, 50, 100, and 200 EMAs.
The structure, as discussed, is labeled as W-X-Y. Wave (X) occurred at 47.80, and wave (Y) made a low of 38, which is 78.6% of wave (W). The common retracement is 100%, but the three-wave move in wave (Y) appears to be complete. Traders can see the sub-waves of the impulsive cycle. For safe traders, if the price breaks out wave B at 42, traders can buy for the following targets: 43.9 – 46.2 – 47.8+.
 Unlock This Article
Only Premium members will have access to further information.
Get free important share market ideas on stocks & nifty tips chart setups, analysis for the upcoming session, and more by joining the below link: Stock Tips
Have you any questions/feedback about this article? Please leave your queries in the comment box for answers.
hi can anyone tell me how can i improv my skill by practice? i mean give me some homework to do or some practices for chart.
i want to do practice but i don’t know what to practice.