


Timeframe: Daily
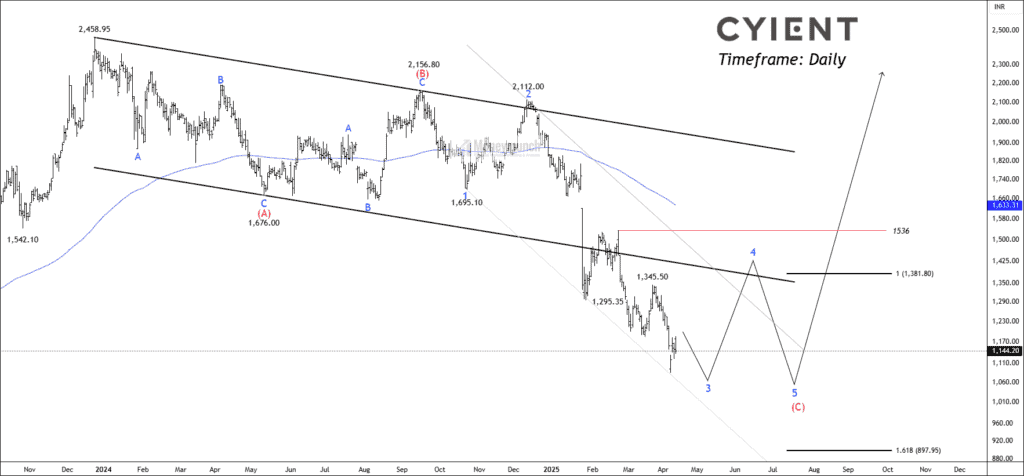
The chart outlines multiple corrective patterns labeled as A-B-C and impulsive waves marked 1 to 5. The price is currently in a downtrend within a large falling channel, showing lower highs and lower lows, indicating bearish momentum. Key turning points are marked, like highs around ₹2,458 and lows around ₹1,084.
Based on the wave count, the chart suggests that the stock is currently in Wave 3 of a larger C wave, indicating continued downside before a possible bottom formation. There’s a forecast of further decline toward the ₹900–₹1,000 range before Wave 5 of C completes. After that, a major reversal is expected, possibly marking the end of the corrective structure and beginning a fresh bullish impulse.
Key technical levels to watch are resistance at ₹1,536 and support around ₹897. The 200-day EMA at ₹1,633 acts as a major dynamic resistance. A break above ₹1,536 with strong volume could invalidate the bearish count and signal a potential long-term trend reversal. Until then, caution is advised for long positions.
 Unlock This Article
We will update further information for premium subscribers soon.
Get free important share market ideas on stocks & nifty tips chart setups, analysis for the upcoming session, and more by joining the below link: Stock Tips
Have you any questions/feedback about this article? Please leave your queries in the comment box for answers.

Brilliant use of Elliott Wave Theory here
Clean and precise wave count. Great job!
Brilliant technical breakdown!