


On the weekly chart, Cipla is in a strong long-term uptrend and continues to trade within a rising channel. The structure shows clear higher highs and higher lows, which confirms that buyers are still in control. Price is holding above key moving averages, indicating the trend remains healthy. The recent sideways movement appears to be a consolidation after a strong rise rather than a sign of weakness. As long as the stock stays above the channel support, the overall weekly trend remains positive.

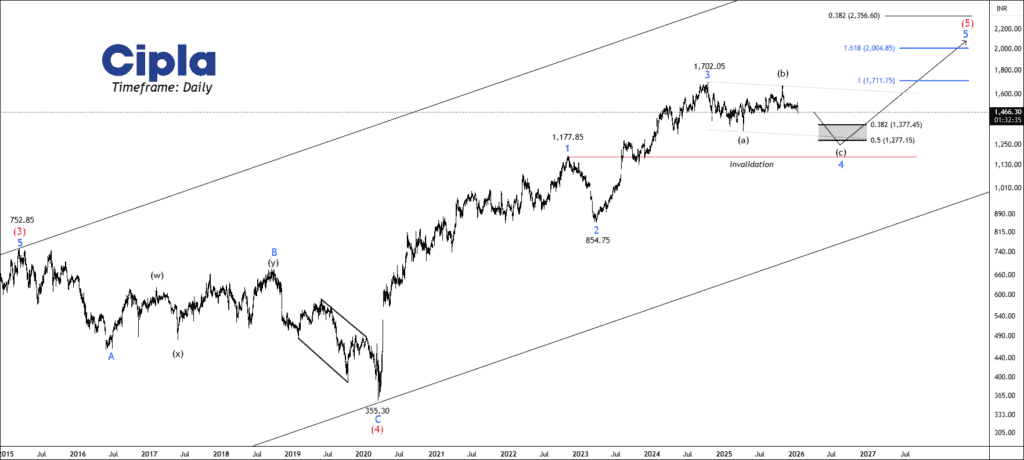
NSE CIPLA is still in an overall uptrend on the daily chart, but the price is currently moving sideways, showing a pause after a strong rise. This sideways move looks like a corrective phase rather than a trend change. If wave C of wave 4 completes, traders can look for fresh buying opportunities. Upside targets after confirmation are 1626 – 1700 – 1850+
For now, the bearish scenario is activated after a breakdown below 1463. For safe traders, if the price breaks below wave A near 1390, it may move toward around 1277, but in a normal corrective move, the price should not fall below wave 1 near 1177.
We will update lower timeframe chart for premium members soon.
Get free important share market ideas on stocks & nifty tips chart setups, analysis for the upcoming session, and more by joining the below link: Stock Tips
Have you any questions/feedback about this article? Please leave your queries in the comment box for answers.

Chart is neat and well organized. The trade idea makes perfect sense.
can you analyse hdfcbank too?
You called nifty, banknifty, and finnifty everyweek. Anyone not watching, isn’t capitalizing. Great analysis.
The market is clearly in a decision zone. waiting for confirmation.